Visible to Intel only — GUID: GUID-4F5C76C5-8DFC-4AC1-ABAA-3079620EB934
Visible to Intel only — GUID: GUID-4F5C76C5-8DFC-4AC1-ABAA-3079620EB934
Window: Summary After Analysis Is Complete
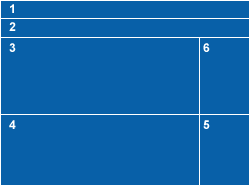
Intel Inspector displays this window after analysis is complete and when you open an existing result.
The Summary window shows application problems detected during analysis, problem severity, and associated code locations. It also provides access to generic error explanations and corresponding source code in your default editor. Use this window to:
View prioritized problems and choose problems of interest to display in the Sources window.
Temporarily limit the problem list to only those items that meet specific criteria.
Graphically visualize the relationship between threads and code locations.
Change problem state and suppress problems to help you focus on only those problems that require your attention during this and future analysis runs.
Report result data in plain text format.
Merge state information from a result with an overlapping set of problems.
Launch a new analysis in conjunction with a debugger to stop at problems of interest.
Window Layout
|
Window Panes and Toolbars |
