A newer version of this document is available. Customers should click here to go to the newest version.
GPU OpenCL™ Application Analysis
If you identified with the Intel® VTune™ Profiler that your application is GPU-bound and your application uses OpenCL™ software technology, you may enable the Trace GPU Programming APIs configuration option for your custom analysis to identify how effectively your application uses OpenCL kernels. By default, this option is enabled for the GPU Compute/Media Hotspots and GPU Offload analyses. To explore the performance of your OpenCL application, use the GPU Compute/Media Hotspots viewpoint.
Follow these steps to explore the data provided by the VTune Profiler for OpenCL application analysis:
-
Analyze GPU usage.
Identify why execution units (EUs) were stalled or idle.
Identify OpenCL kernels overutilizing both Floating Point Units (FPUs).
Explore Summary Statistics
Start your data analysis with the Summary window that provides application-level performance statistics. Typically, you focus on the primary baseline, which is the Elapsed Time metric that shows the total time your target ran:

You can correlate this data with the GPU Time used by GPU engines while your application was running:
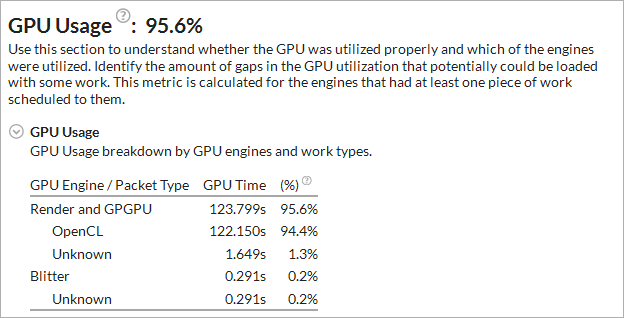
If the GPU Time takes a significant portion of the Elapsed Time (95.6%), it clearly indicates that the application is GPU-bound. You see that 94.4% of the GPU Time was spent on the OpenCL kernel execution.
For OpenCL applications, the VTune Profiler provides a list of OpenCL kernels with the highest execution time on the GPU:
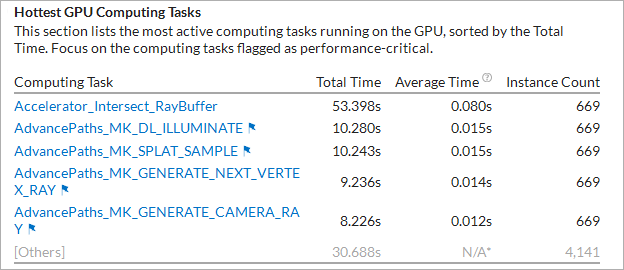
Mouse over the flagged kernels to learn what kind of performance problems were identified during their execution. Clicking such a kernel name in the list opens the Graphics window grouped by computing tasks, sorted by the Total Time, and with this kernel selected in the grid.
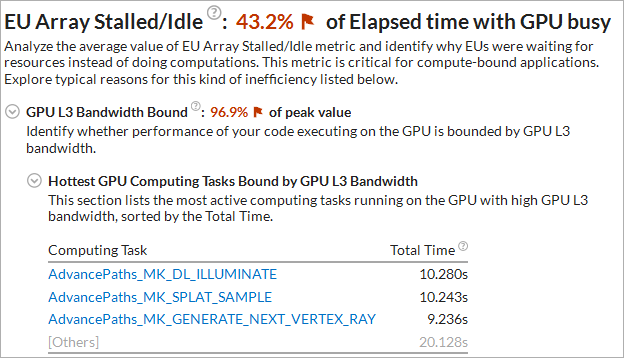
Depending on the GPU hardware events preset you used during the analysis configuration, the VTune Profiler explores potential reasons for stalled/idle GPU execution units and provides them in the Summary. For example, for the Compute Basic preset, you may analyze GPU L3 Bandwidth Bound issues:
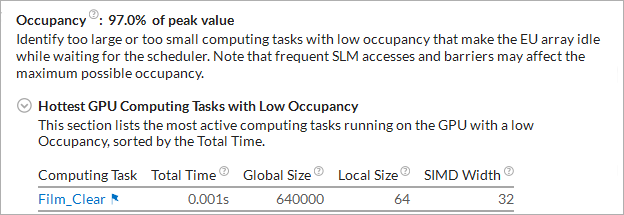
Or potential occupancy issues:
In this example, EU stalls are caused by GPU L3 high bandwidth. You may click the hottest kernels in the list to switch to the Graphics view, drill down to the Source or Assembly views of the selected kernel to identify possible options for cache reuse.
If your application execution takes more than 80% of collection time heavily utilizing floating point units, the VTune Profiler highlights such a value as an issue and lists the kernels that overutilized the FPUs:

You can switch to the Timeline pane on the Graphics tab and explore the distribution of the GPU EU Instructions metric that shows the FPU usage during the analysis run:

Analyze Hot GPU OpenCL Kernels
To view detailed information about all OpenCL kernels running on the GPU, switch to the Graphics window. By default, the grid data is grouped by Computing Task / Instance that shows Compute tasks only. Data collected for program units outside any OpenCL computing tasks are attributed to the [Outside any task] entry.
In the Computing Task columns explore the overall time a kernel ran on the GPU and the average time for a single invocation (corresponding to one call of clEnqueueNDRangeKernel ), working group sizes, as well as averaged GPU hardware metrics collected for a kernel. Hover over a metric column header to read the metric description. If a metric value for a computing task exceeds a threshold set up by Intel architects for the metric, this value is highlighted in pink, which signals a performance issue. Hover over such a value to read the issue description.
In the example below, the Accelerator_Intersect kernel took the most time to execute (53.398s). The GPU metrics collected for this workload show high L3 Bandwidth usage spent in stalls when executing this kernel. For compute bound code it indicates that the performance might be limited by cache usage.
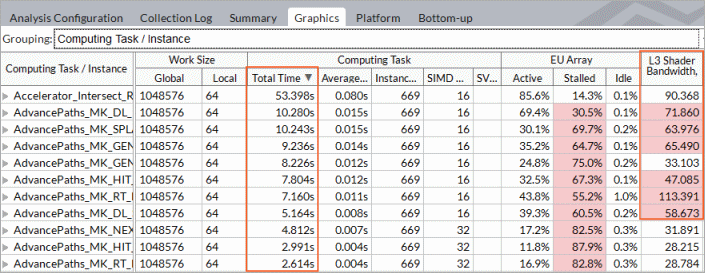
Analyze and optimize hot kernels with the longest Total Time values first. These include kernels characterized by long average time values and kernels whose average time values are not long, but they are invoked more frequently than the others. Both groups deserve attention.
If a kernel instance used the OpenCL 2.0 Shared Virtual Memory (SVM), the VTune Profiler detects it and, depending on your hardware, displays the SVM usage type as follows:
Coarse-Grained Buffer SVM: Sharing occurs at the granularity of regions of OpenCL buffer memory objects. Cross-device atomics are not supported.
Fine-Grained Buffer SVM: Sharing occurs at the granularity of individual loads and stores within OpenCL buffer memory objects. Cross-device atomics are optional.
Fine-Grained System SVM: Sharing occurs at the granularity of individual loads/stores occurring anywhere within the host memory. Cross-device atomics are optional.
Every clCreateKernel results in a line in the Compute category. If two different kernels with the same name (even from the same source) were created with two clCreateKernel calls (and then invoked through two or more clEnqueueNDRangeKernel ), two lines with the same kernel name appear in the table. If they are enqueued twice with a different global or local size or different sets of SVM arguments, they are also listed separately in the grid.
Correlate OpenCL Kernels Data with GPU Metrics
In the Graphics window, explore the Timeline pane > Platform tab to analyze OpenCL kernels execution over time.
OpenCL APIs (for example, clWaitForEvents) show up on the Thread area as tasks:
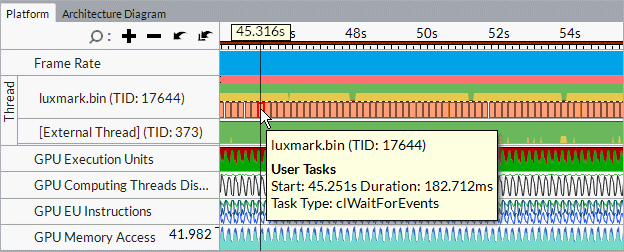
Correlate GPU metrics and OpenCL kernels data:
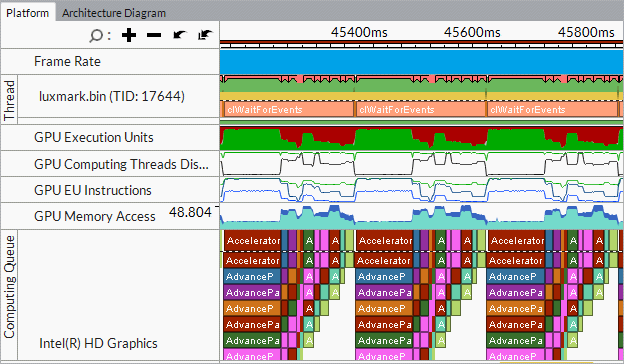
GPU hardware metrics are available if you enabled the Analyze Processor Graphics events option for Intel® HD Graphics or Intel® Iris® Graphics. To collect these metrics, make sure to set up your system for GPU analysis.
You may find it easier to analyze your OpenCL application by exploring the GPU hardware metrics per GPU architecture blocks. To do this, choose the Computing Task grouping level in the Graphics window, select an OpenCL kernel of interest and click the Memory Hierarchy Diagram tab in the Timeline pane. VTune Profiler updates the architecture diagram for your platform with performance data per GPU hardware metrics for the time range the selected kernel was executed.
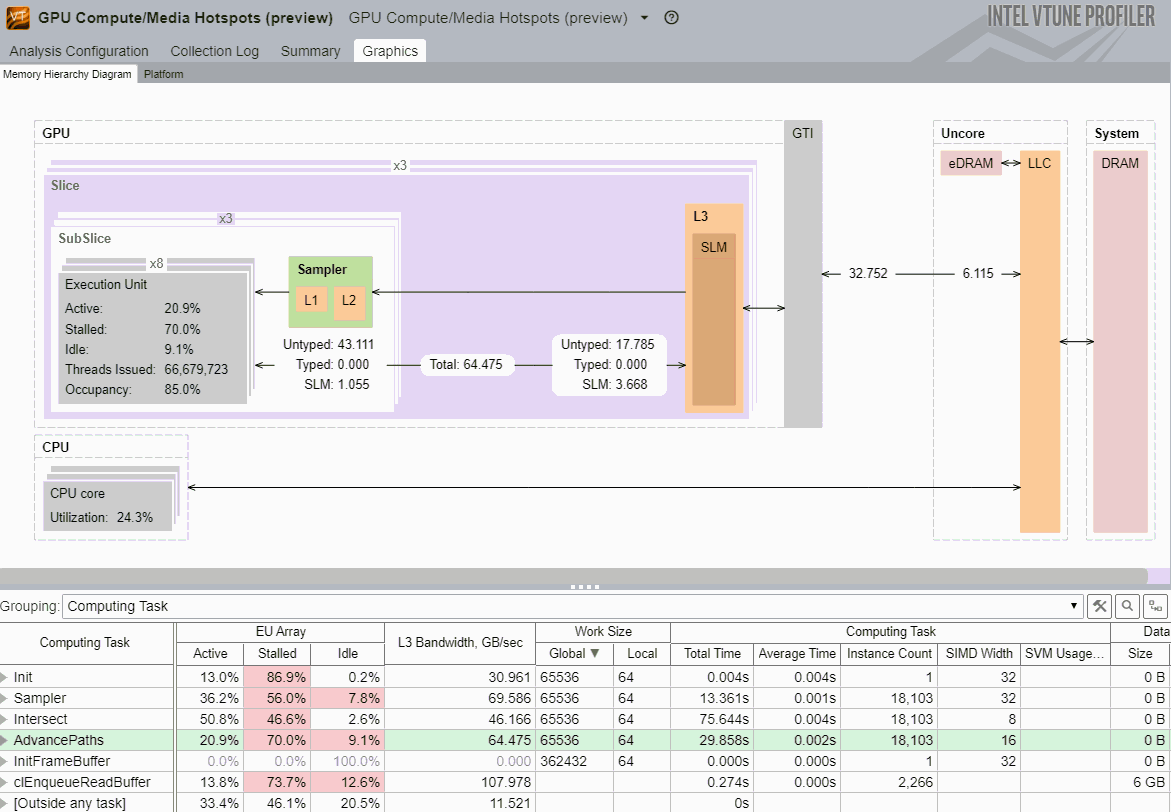
Currently this feature is available starting with the 4th generation Intel® Core™ processors and the Intel® Core™ M processor, with a wider scope of metrics presented for the latter one.
You can right-click the Memory Hierarchy Diagram, select Show Data As and choose a format of metric data representation:
Total Size
Bandwidth (default)
Percent of Bandwidth Maximum Value
Explore the Computing Queue
To view details on OpenCL kernels submission, in particular distinguish the order of submission and execution, and analyze the time spent in the queue, zoom in and explore the Computing Queue data in the Timeline pane. You can click a kernel task to highlight the whole queue to the execution displayed at the top layer. Kernels with the same name and size show up in the same color.
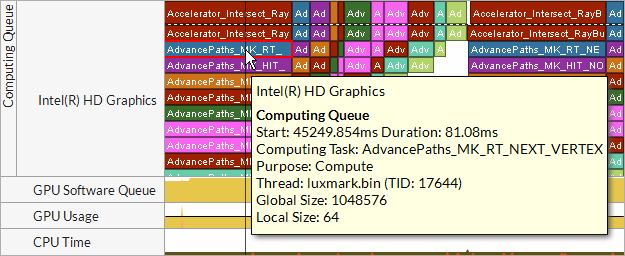
VTune Profiler displays kernels with the same name and size in the same color. Synchronization tasks are marked with vertical hatching  . Data transfers, OpenCL routines responsible for transferring data from the host system to a GPU, are marked with cross-diagonal hatching
  .
.
In the Attach mode if you attached to a process when the computing queue is already created, VTune Profiler will not display data for the OpenCL kernels in this queue.
Analyze Source and Assembly Code
You may select a computing task of interest in the grid view, double-click it to open the Source/Assembly window and analyze the code for the selected kernel (with source files available).

Analyze the assembler code provided by your compiler for the OpenCL kernel, estimate its complexity, identify issues, match the critical assembly lines with the affected source code, and optimize, if possible. For example, if you see that some code lines were compiled into a high number of assembly instructions, consider simplifying the source code to decrease the number of assembly lines and make the code more cache-friendly.
Explore GPU metrics data per computing task in the Graphics window and drill down to the Source/Assembly view to explore instructions that may have contributed to the detected issues. For example, if you identified the Sampler Busy or Stalls issues in the Graphics window, you may search for the send instructions in the Assembly pane and analyze their usage since these instructions often cause frequent stalls and overload the sampler. Each send/sends instruction is annotated with comments in square brackets that show a purpose of the instruction, such as data reads/writes (for example, Typed/Untyped Surface Read), accesses to various architecture units (Sampler, Video Motion Estimation), end of a thread (Thread Spawner), and so on. For example, this sends instruction is used to access the Sampler unit:
0x408 260 sends (8|M0) r10:d r100 r8 0x82 0x24A7000 [Sampler, msg-length:1, resp-length:4, header:yes, func-control:27000]
Source/Assembly support is available for OpenCL programs with sources and for kernels created with IL (intermediate language), if the intermediate SPIR-V binary was built with the -gline-tables-only -s <cl_source_file_name> option.
The Source/Assembly analysis is not supported for the source code using the #line directive.
If your OpenCL kernels use inline functions, you can enable the Inline Mode filter bar option to view inline functions in the grid and analyze them in the Source view.