A newer version of this document is available. Customers should click here to go to the newest version.
Generate Command Line Configuration from GUI
For an analysis or summary result that is open in Intel® VTune™ Profiler, get the equivalent command to use from the command line. Use these commands in a terminal window to switch from using the GUI.
Switch Analysis Runs from GUI to Command Line
Once you have an analysis set up in VTune Profiler,
Click the
 Command Line button at the bottom of the configuration window.
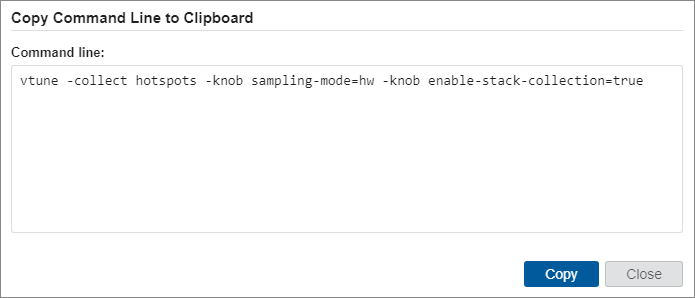
 The Copy Command Line to Clipboard dialog box opens to display the equivalent command for your analysis configuration. Options with default values are hidden.
For predefined analysis types, the -collect <analysis-type> option is applied:
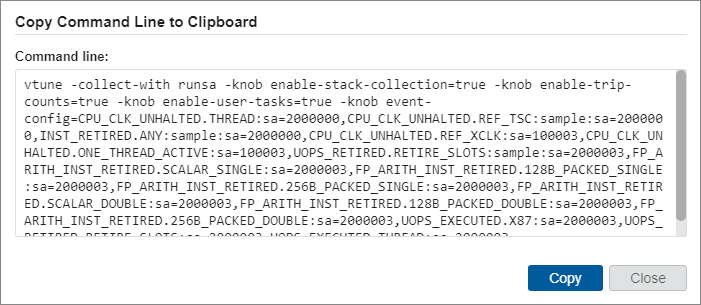
For custom analysis types, the -collect-with <collector-type> option is applied:
If you analyze a remote application from the local host, make sure to:
Set up your remote Linux or Android target system for data collection.
Specify the correct path to the remote application in the command line.
Use the -target-system=<system_details> option to specify your remote target address (for Linux) or device name (for Android). For example:
host>./vtune -target-system=ssh:user@hostName -collect hotspots -- myapp
If necessary, you can also edit the command in the terminal window before execution.
Copy the command line to your clipboard.
In a terminal window, paste and run the command.
VTune Profiler collects the data and saves the result to the analysis result directory under your working directory.
To enable analyzing the source code, make sure to copy the required symbol/source files from your remote machine and update the search directories in the Binary/Symbol Search or Source Search dialog boxes.
Open GUI Results from Command Line
When you have analysis results open in the VTune Profiler GUI and you want to continue working on them from the command line, use the Copy Command Line to Clipboard option. This option is available in the following windows:
- Summary window
- Bottom-up window
- Top-down tree window
In one of these windows, for the analysis result or data section of your choice,
Click the
 button next to a metric or result. The Copy Command Line to Clipboard dialog box opens to display the equivalent command for the chosen metric.
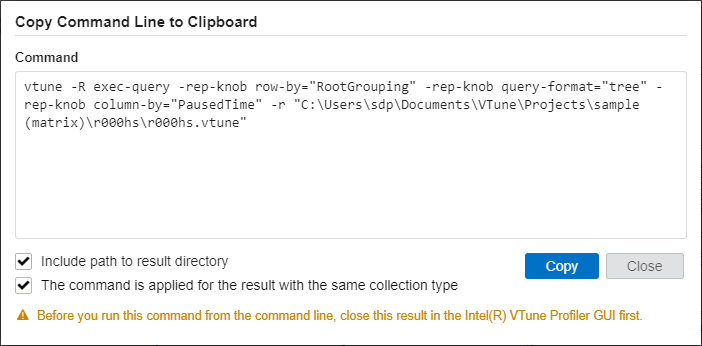
Use these options as needed:
- Use the current location of the result directory for the command line result as well.
- Apply the command to other results that contain the same default viewpoint. The command line result then retains the same column structure.
Copy the command line to your clipboard.
In a terminal window, paste the command.
Close the result in the GUI, if it is open.
Run the command in the terminal window.