Identify Communication Issues with Intel® Trace Analyzer and Collector
There are three key reasons for an application to be MPI-bound:
High wait times inside the MPI library. This occurs when a process waits for the data from other processes. This case is characterized with high values of MPI Imbalance indicator.
Active communications.
Poor or incorrectly set optimization settings of the library.
The first two issues can be addressed with the help of the Intel® Trace Analyzer and Collector. Profiling with this tool is as easy as with Application Performance Snapshot - you just need to add the -trace option to the launch command.
Run Intel Trace Analyzer and Collector Analysis
Assuming that you have set up the Intel® MPI Library environment, follow these steps to perform the analysis:
Set up the environment for the Intel Trace Analyzer and Collector:
$ source <itac_installdir>/bin/itacvars.sh
where <itac_installdir> is the installed location of Intel Trace Analyzer and Collector (default location is /opt/intel).
Run the heart_demo application with the -trace option. Use the host file created in the previous step and use the same processes and threads configuration:
$ export OMP_NUM_THREADS=64
$ mpirun -genv VT_LOGFILE_FORMAT=SINGLESTF -trace -n 16 -ppn 2 -f hosts.txt ./heart_demo -m ../mesh_mid -s ../setup_mid.txt -t 50
In this launch command, the -genv VT_LOGFILE_FORMAT=SINGLESTF setting ensures that the resulting trace file be generated as a single file, rather than a set of files (default).
The heart_demo.single.stf file is created.
Open the trace file to analyze the application:
$ traceanalyzer ./heart_demo.single.stf &
Interpret Intel Trace Analyzer and Collector Result Data
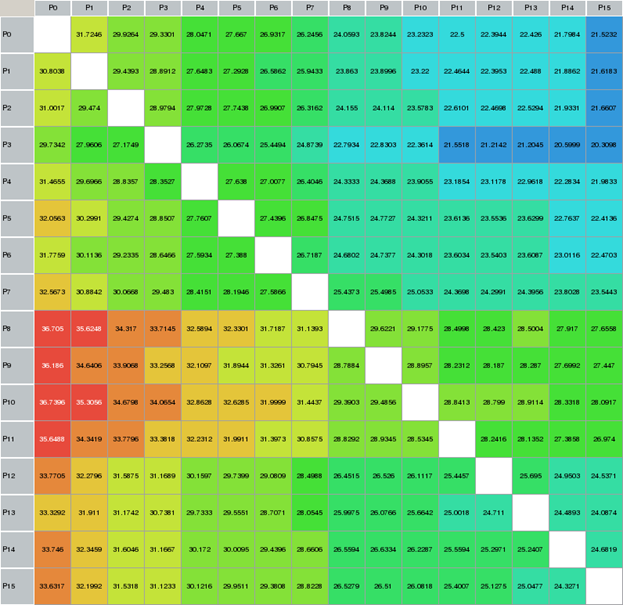
Among all of the Intel® Trace Analyzer charts, in the case of the heart_demo application, the most informative is the Message Profile. This chart indicates the intensity of point-to-point communications for each sender-receiver pair.
To open the Message Profile chart, go to Charts > Message Profile or press Ctrl + Alt + M. For the heart_demo application, the chart should look similar to this:

In this chart, the vertical processes bar represents the sender ranks, and the horizontal bar represents the receiver ranks. As you can see from the chart, each rank communicates with the others, and rank 0 receives slightly more messages that the others.
Such a picture is typical for a communication pattern where one of the processes (in this case, with number 0) is a so-called "master" process that distributes the workload between others and gathers the results of calculations.
Key Take-Away
When evaluating an application with Intel Trace Analyzer and Collector, it is not always obvious where the problem area is. Examine the application and all available charts closely to find issues. If your application is MPI-bound, start by determining if the issue is due to high MPI library wait times, active communications, or poor library optimization settings.