Analyze Serial and Parallel Code Efficiency with Intel® VTune™ Profiler
After updating the vector instruction set, collect performance data again with Intel VTune Profiler to find additional optimization opportunities.
- Collect Performance Data: Collect HPC Performance Characterization data again.
- Interpret Results: Review the results for problem functions.
- Fix and Rebuild the Application: Update the application to improve parallelism.
- Review Application Performance: Compare current application performance to initial performance results collected at the beginning of the tutorial.
Collect and Review Application Performance Data
Collect HPC Performance Characterization performance data:
Launch the application using VTune Profiler and the appropriate rank number.
$ export OMP_NUM_THREADS=64
$ mpirun -n 16 -ppn 2 -f hosts.txt -gtool "vtune -collect hpc-performance -data-limit=0 -r result_second:7" ./heart_demo -m ../mesh_mid -s ../setup_mid.txt -i -t 50
NOTE:Replace the rank number in the second command with the rank identified in the previous section. In the example command, the rank value is 7.
Open the result in the VTune Amplifer GUI and start with the Summary window.
$ amplxe-gui result_second.<host>/result_second.<host>.amplxe &
Interpret Results
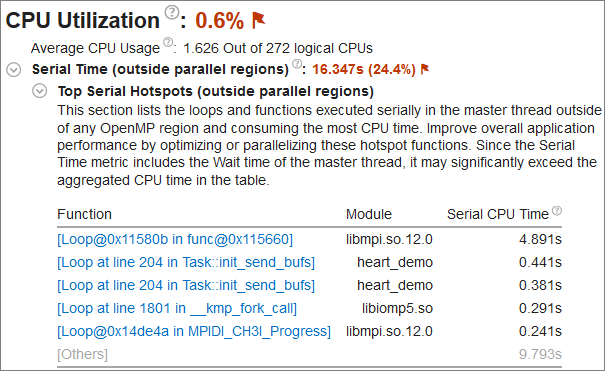
In the CPU Utilization section, expand Serial Time (outside parallel regions) to view the Top Serial Hotspots (outside parallel regions) list.

The first function in the table is part of the MPI library called by the application. Since it is not part of the heart_demo application, it does not make sense to optimize this function. Instead, start with the init_send_bufs function, which appears twice in the table due to an optimization provided by the compiler.
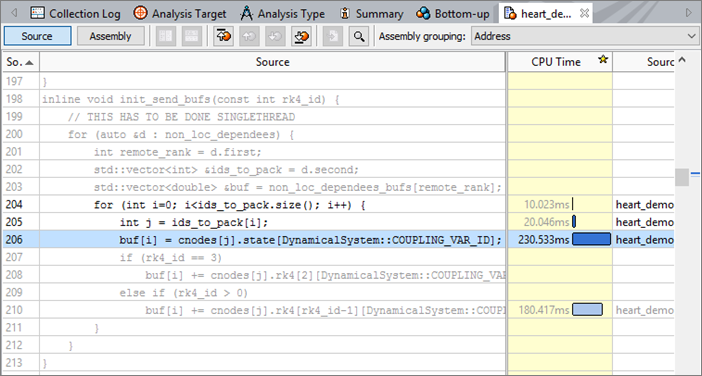
Switch to the Bottom-up tab, set the grouping to OpenMP Region / Thread / Function / Call Stack, and apply the filter at the bottom of the window to show Functions only. Expand the tree to find that the init_send_bufs function is only called by Thread 0. Double click this line to open the source code view.

Use the source code view to see that this code has not been parallelized at the threading level while it is divided between ranks and that it has a high CPU time. While the outer loop of this function should be single-threaded, the enclosed loop can be parallelized by adding another OpenMP pragma before the loop: #pragma omp parallel for.
Switch back to the Bottom-up tab and review additional functions with a high CPU time. The application also spends time in the _kmp_join_barrier function. This is a result of synchronization barriers at each #pragma omp parallel for construct, which introduces additional overhead. The heart_demo application has several of these constructs and can be optimized by using only a single #pragma omp parallel construct and several #pragma omp for constructs inside it to eliminate the costly join barriers of #pragma omp parallel constructs.
Rebuild Application to Improve Parallelism
A fix to the sample application is available in the heart_demo_opt.cpp file. You can review these changes by running a comparison between the heart_demo.cpp and heart_demo_opt.cpp files.
Rebuild the application using the following command:
$ mpiicpc ../heart_demo_opt.cpp ../luo_rudy_1991.cpp ../rcm.cpp ../mesh.cpp -g -o heart_demo -O3 -xMIC-AVX512 -std=c++11 -qopenmp -parallel-source-info=2
Review and Compare Application Performance
Check the performance of the two best MPI/OpenMP* combinations one final time to see the overall improvement in application performance. Run the following commands to check performance:
$ time run_ppn2_omp64.sh
$ time run_ppn32_omp4.sh
The following results are an example of the overall performance improvement:
Combination (MPI/OpenMP) |
Computation Time |
Elapsed Time |
|---|---|---|
2/64 |
11.91 |
28.13 |
32/4 |
16.39 |
46.14 |
Notice that the computation time and elapsed time for 2/64 has finally improved over 32/4. The previously non-parallelized code now runs faster on more threads. We also removed the barriers in each OpenMP construct, which reduced the application wait time.
This table shows the overall performance improvement for computation time:
Combination (MPI/OpenMP) |
2/64 |
32/4 |
Original Computation Time |
57.15 |
172.60 |
MPI-Tuned Computation Time |
19.43 |
15.92 |
Improved Vectorization Computation Time |
16.32 |
15.37 |
Final Computation Time |
11.91 |
16.39 |
This table shows the overall performance improvement for elapsed time:
Combination (MPI/OpenMP) |
2/64 |
32/4 |
Original Elapsed Time |
73.56 |
202.29 |
MPI-Tuned Elapsed Time |
35.66 |
45.65 |
Improved Vectorization Elapsed Time |
32.54 |
45.17 |
Final Elapsed Time |
28.13 |
46.14 |
Key Take-Away
Review the Bottom-up tab in Intel VTune Profiler to identify problem functions and find sections of your application that would benefit from parallelism.