A newer version of this document is available. Customers should click here to go to the newest version.
Visible to Intel only — GUID: GUID-778E9780-783C-41E9-BD15-38795950F1A0
Visible to Intel only — GUID: GUID-778E9780-783C-41E9-BD15-38795950F1A0
Poor Port Utilization
Profile a core-bound matrix application using the Microarchitecture Exploration analysis in Intel® VTune™ Profiler. Understand the cause for poor port utilization and use Intel® Advisor to benefit from compiler vectorization.
Content expert: Jeffrey Reinemann
Ingredients
This section lists the hardware and software tools used for the performance analysis scenario.
Application: The matrix multiplication sample that multiplies 2 matrices of 2048x2048 size, matrix elements have the double type. Find the matrix sample package in the VTune Profiler package in the <install-dir>/samples/en/C++ directory or download it from the GitHub samples repository.
Performance analysis tools:
Intel VTune Profiler-Microarchitecture Exploration analysis
Intel Advisor-Vectorization analysis
Operating system: Linux*, Ubuntu 22.04.2 LTS
CPU: Intel® Core™ i7-6700K processor code named SkyLake (6th generation)
Create Baseline
Optimize the initial version of the matrix code with a naïve multiplication algorithm. See the Frequent DRAM Accesses recipe), the execution time has reduced from 22 seconds to 1.3 seconds. This is a new performance baseline for further optimizations.
Run Microarchitecture Exploration Analysis
Next, run the Microarchitecture Exploration analysis to get a high-level understanding of potential performance bottlenecks in the sample application:
Click the
 New Project button on the toolbar and specify a name for the new project, for example: matrix.
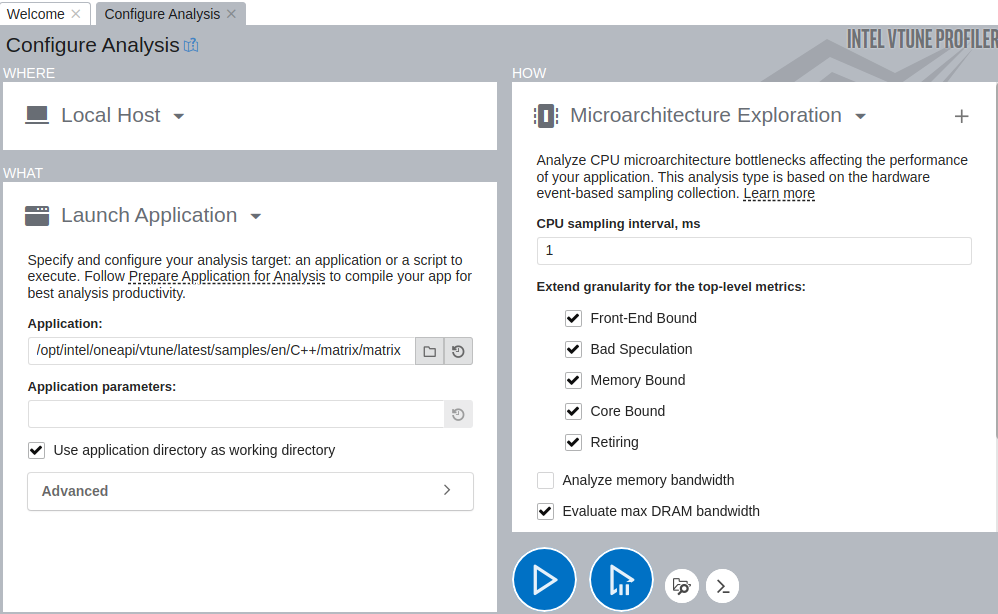
 - In the Configure Analysis window, make these selections:
In the WHERE pane, select the Local Host target system type.
In the WHAT pane, select the Launch Application target type and specify an application for analysis.
In the HOW pane, select the Microarchitecture Exploration analysis type.
NOTE:For short duration workloads(~under 5 seconds) like the optimized version of the matrix application, you may get more accurate values by reducing the sampling interval to 0.5 seconds. Click Start to run the analysis.

Once VTune Profiler collects data and finalizes results (after resolving symbol information for successful source analysis), you are ready to examine the causes for poor port utilization.
Understand Poor Port Utilization
Start with the Summary view that shows high-level statistics for the application performance per hardware metrics:

You see that the dominant bottleneck has moved to Core Bound > Port Utilization. More than 3 execution ports were utilized simultaneously for the majority of the time. The Vector Capacity Usage metric value is also flagged as critical, which means that the code was either not vectorized or vectorized poorly. To confirm this, switch to the Assembly view of the kernel as follows:
Click the Vector Capacity Usage (FPU) metric to switch to the Bottom-up view sorted by this metric.
Double-click the hot multiply1 function to open its Source view.
Click the Assembly button on the toolbar to view the disassembly code:

You see that scalar instructions are used. The code is not vectorized.
Explore Options for Vectorization
To understand what prevents the code from being vectorized, use the Vectorization Advisor tool in Intel® Advisor.

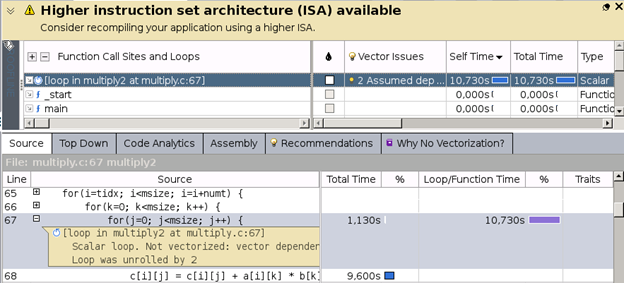
In the graphic, we see that the loop was not vectorized due to assumed dependencies. For further details, mark the loop and run the Dependencies analysis in Intel Advisor:

The Dependencies report informs us that there are no actual dependencies found. There is a recommendation to use #pragma to make the compiler ignore the assumed dependencies:

With the #pragma added, the matrix code looks as follows:
void multiply2_vec(inte msize, int tidx, int numt, TYPE a[][NUM],
    TYPE b[][NUM], TYPE c[][NUM], TYPE t[][NUM]
{
    int i,j,k;

    for(i=tidx; i<msize; i=i+numt) {
        for(k=0; k<msize; k++) {
#pragma ivdep
            for(j=0; j<msize; j++) {
                c[i][j] = c[i][j] + a[i][j] * b[i][j];
            }
        }
    }
}
Compiling and running the updated code results in 0.7 second speed-up in the execution time.
Compile with the Latest Instruction Set
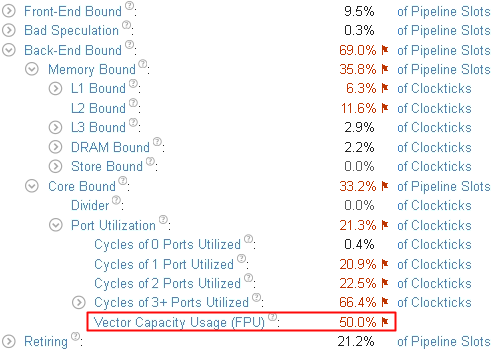
Repeat the Microarchitecture Exploration analysis in VTune Profiler on the updated code to see the following result:

The Vector Capacity Usage has improved but is still only 50% and has been flagged. Look into the Assembly view once again:

Here, we see that the code uses SSE instructions while the CPU in this use case supports the AVX2 instruction set.
To apply it, re-compile the code with the -xCORE-AVX2 option and run the Microarchitecture Exploration analysis once more.
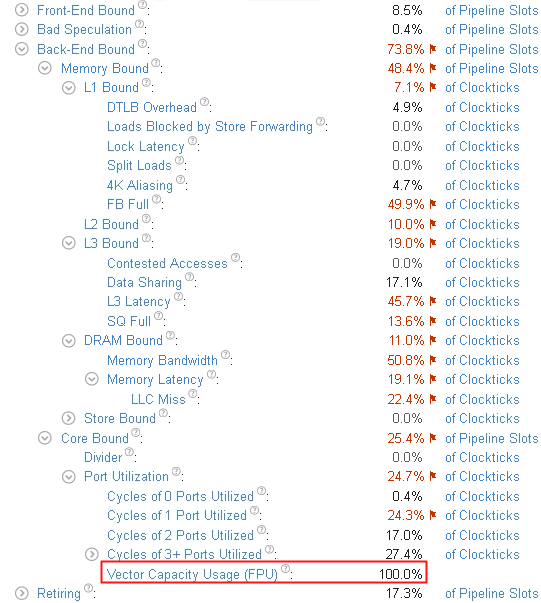
For the recompiled code, the execution time has dropped to 0.6 seconds. Repeat the Microarchitecture Exploration analysis to verify the optimization. The Vector Capacity Usage metric value is now 100%:
