Tutorial
Analyze MPI Applications with Intel® Trace Analyzer and Collector and Intel® VTune™ Profiler
Ungroup MPI Functions
Analyze MPI process activity in your application.
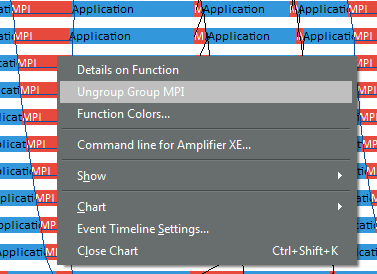
To see the particular MPI functions called in the application, right-click on MPI (marked with a red rectangle) in the Event Timeline and select Ungroup Group MPI. This operation exposes the individual MPI calls.
After ungrouping the MPI functions, you see that the processes communicate with their direct neighbors using MPI_Sendrecv at the start of the iteration.
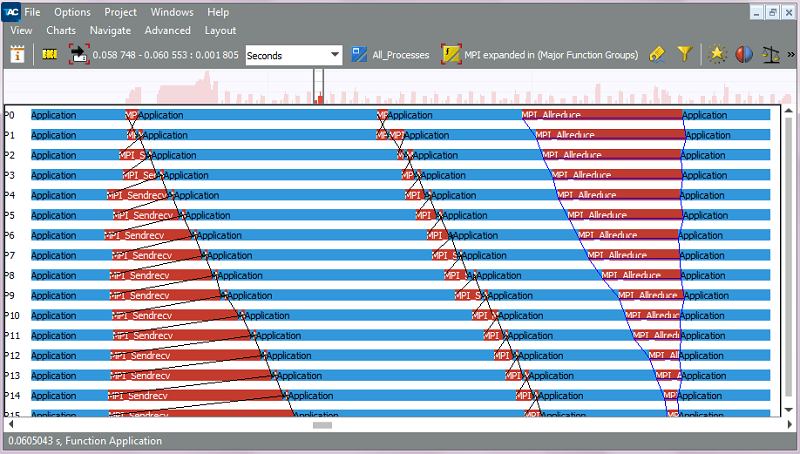
This data exchange has a disadvantage: process i does not exchange data with its neighbor i+1 until the exchange between i-1 and i is complete. This delay appears as a staircase pattern resulting with the processes waiting for each other.
The MPI_Allreduce at the end of the iteration resynchronizes all processes; that is why this block has the reverse staircase appearance.