Trace Your MPI Application
Generate a trace file to collect event logs for the following application behavior analysis.
Set up the environment for launching the Intel® Trace Analyzer and Collector by running the setvars script from the oneAPI installation directory.
NOTE:By default, Intel Trace Analyzer and Collector is installed to /opt/intel/oneapi/itac for Linux* OS and to Program Files (x86)\Intel\oneAPI\itac\latest for Windows* OS.
On Linux:
On Windows:
Run your MPI application and generate a trace with the -trace option.
On Linux:
On Windows:
Compile the app and collect the trace.
For Intel oneAPI DPC++/C++ Compiler, run:
For Intel Fortran Compiler, run:
This example generates a trace (stf*) for a sample poisson_sendrcv.single MPI application running on 4 nodes.
Open the generated .stf file with Intel Trace Analyzer with Intel Trace Analyzer and Collector.
On Linux:
$ traceanalyzer ./ poisson_sendrecv.single.stf
On Windows:
> traceanalyzer poisson_sendrecv.single.stf
NOTE:For testing purposes, you can download a pre-collected trace file poisson_sendrecv.single.stf for the poisson used in this document and open it with Intel Trace Analyzer and Collector.
The .stf file opens in the Summary Page view, which represents general information about your application performance:
Output Description 
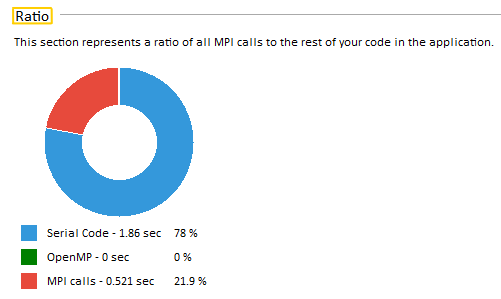
This section represents a ratio of all MPI calls to the rest of your code in the application.

This section lists the most active MPI functions from all MPI calls in the application.