Visible to Intel only — GUID: aih1678133244966
Ixiasoft
Visible to Intel only — GUID: aih1678133244966
Ixiasoft
6.5.7.2. Comparison Use Case
Comparison allows you to determine whether certain design changes result in the compilation results that you want. You can compare the aggregate-before results to the aggregate-after results. Exploration Dashboard can analyze multiple seeds of each version of the design together first, and then compare the common results across versions of the design. In comparison use cases, the goal is to decide if the design changes made the design better or worse overall.

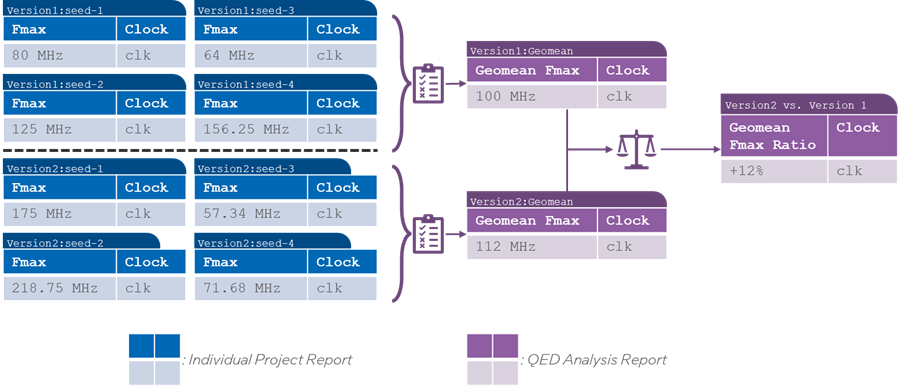
Visualization of Fmax Aggregation and Comparison Analysis illustrates an example of aggregation followed by comparison. In this example use-case:
- The designer first compiles “Version1” of their design four times through four different seed values.
- The designer next makes some changes to the design for “Version2”.
- The designer compiles “Version2” four times.
To determine if the “Version2” design changes improve the design performance overall, the designer can follow these steps:
- Aggregate the Fmax results from each version by taking the geometric mean (geomean) of the Fmax across seeds.
- Compare the geomean values and conclude that “Version2” has an expected +12% improvement to Fmax compared to "Version1".
The Exploration Dashboard is instrumental in this comparison because no other individual seed versus seed comparison can show this result. Comparison of the individual compilation results can lead to a different conclusion.