Visible to Intel only — GUID: GUID-A5FDECA8-1481-47F7-84B7-30D9D1C46783
Visible to Intel only — GUID: GUID-A5FDECA8-1481-47F7-84B7-30D9D1C46783
Example: Threading Problem
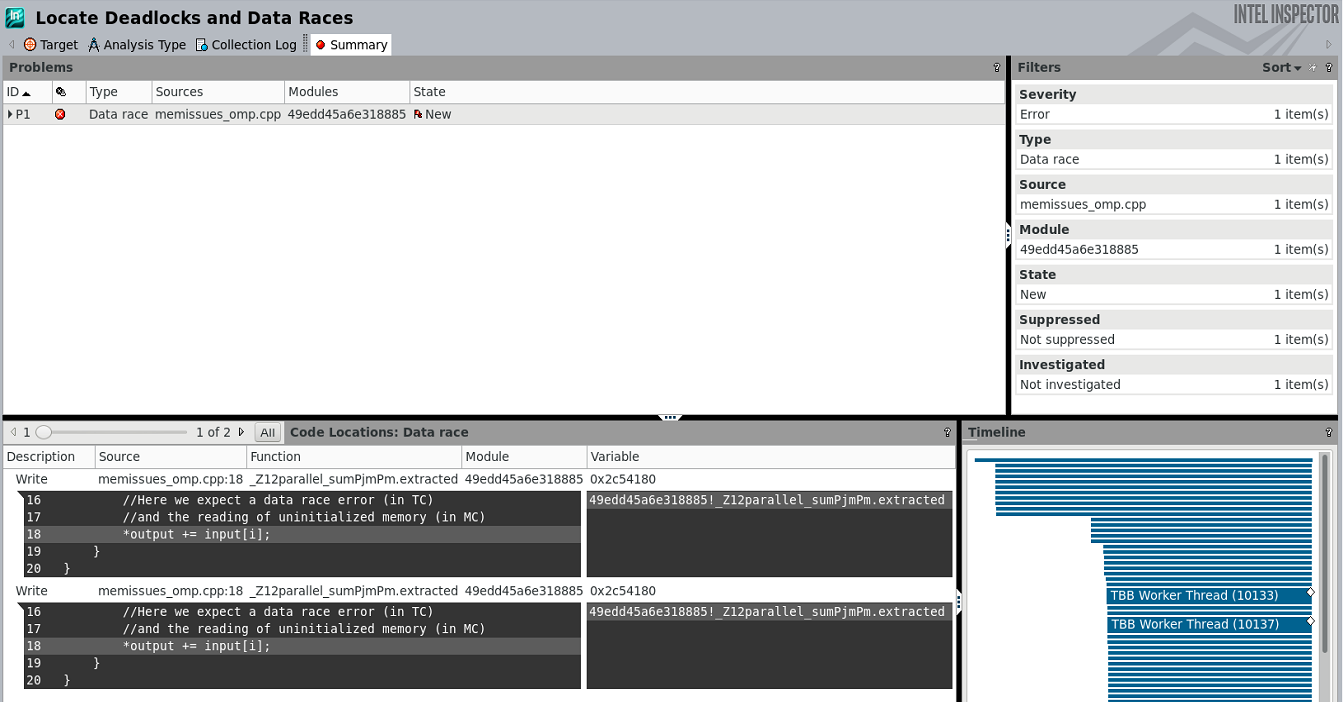
In this example, Intel Inspector detects a data race. This problem happens when two or more unordered threads operate the same data, which may result in incorrect data in the write location.
To locate the variable that is used as a write location, click on a problem in the results window, and Intel Inspector highlights problematic lines in source code.

If Intel Inspector reports a data race, the problem might include several call stacks and appear in several instances:
- Call stacks from parallel threads attempt to use the same variable (for example, 'read' or 'write')
- Optional: Call stack to variable allocation location helps to locate the name of the variable participating in the data race
- Optional: Call stack to recommended synchronization primitive can be used to fix this problem
To root cause the problem, start with analysis of call stacks access and see why your application uses the problematic variable without synchronization. Look at the variable call stack to identify the exact variable involved into the data race condition. Sometimes it is useful to look at other instances of the problem to understand circumstances leading to that error.
To solve the data race problem from the example above, enforce threads ordering by uncommenting the #pragma omp atomic line . This is not an optimal solution for performance (use OpenMP reduction instead) but it will fix the data race.