Standalone GUI: Build Application and Create New Project
Intel® Inspector is a dynamic memory and threading error checking tool for users developing serial and multithreaded applications on Windows* and Linux* operating systems. This topic is part of a tutorial that shows how to find and fix memory errors using the Intel Inspector and a C++ sample application.
To create an application the Intel Inspector can inspect for memory errors:
Get Software Tools
You need the following tools to try tutorial steps yourself using the tachyon_insp_xe sample application:
Intel Inspector installation package and license
.tgz file extraction utility
Supported compiler (see Release Notes for more information)
Editor
Acquire the Intel Inspector
If you do not already have access to the Intel Inspector, you can download an evaluation copy from http://software.intel.com/en-us/articles/intel-software-evaluation-center/.
Install and Set Up the Intel Inspector Sample Application
Copy the tachyon_insp_xe.tgz file from the <install-dir>/samples/<locale>/C++/ directory to a writable directory or share on your system. The default <install-dir> is inside /opt/intel/.
Extract the sample from the .tgz file to create the tachyon_insp_xe directory.
Ensure you have set the EDITOR or VISUAL environment variable to your text editor.
Samples are non-deterministic. Your screens may vary from the screen captures shown throughout this tutorial.
Samples are designed only to illustrate the Intel Inspector features; they do not represent best practices for creating code.
Understand Optimal Compiler/Linker Settings
You can use the Intel® Inspector to analyze memory and threading errors in both debug and release modes of C++ and Fortran binaries; however, applications compiled/linked in debug mode using the following settings produce the most accurate and complete analysis results.
Compiler/Linker Property |
Correct C/C++ Setting |
Impact If Not Set Correctly |
|---|---|---|
Debug information |
Enabled (-g) |
Missing file/line information |
Optimization |
Disabled (-O0) |
Incorrect file/line information |
Dynamic runtime library |
Selected (-shared-intel for Intel(R) compilers; default or -Bdynamic for GNU compilers) |
False positives or missing code locations |
Basic runtime error checks |
Disabled (do not use -fmudflap) |
False positives |
Compiler/Linker Property |
Correct Fortran Setting |
Impact If Not Set Correctly |
Debug information |
Enabled (-debug or -g) |
Missing file/line information |
Optimization |
Disabled (-O0) |
Incorrect file/line information |
Dynamic runtime library |
Selected (-shared-intel) |
False positives or missing code locations |
Basic runtime error checks |
None (-check:none) |
False positives |
Build the Application
In a terminal session, change directory to the tachyon_insp_xe directory.
Type make.
Verify the Application Runs Outside the Intel Inspector
In the same terminal session, type ./tachyon.find_and_fix_memory_errors to execute the sample application.
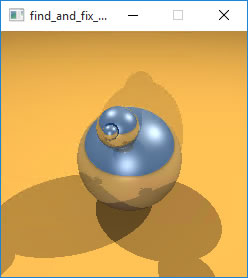
Check for application output similar to the following:

Notice the application output window is empty. The cause: Memory errors. This is how the application output should look after various memory errors are resolved:

Set up the Intel Inspector Environment
Do one of the following to set up the Intel Inspector environment:
Run one of the following source commands:
For csh/tcsh users: source <inspector-install-dir>/inspxe-vars.csh
For bash users: source <inspector-install-dir>/inspxe-vars.sh
NOTE:The name of this script for the application as part of an Intel® oneAPI HPC Toolkit or Intel® oneAPI IoT Toolkit installation is env\vars instead of inspxe-vars.The default installation path, <inspector-install-dir>, is inside:
/opt/intel/ for root users
$HOME/intel/ for non-root users
Add <inspector-install-dir>/bin32 or <inspector-install-dir>/bin64 to your path.
Open the Intel Inspector Standalone GUI
In the same terminal session, type inspxe-gui & to run the Intel Inspector standalone GUI in the background.
Create a New Project
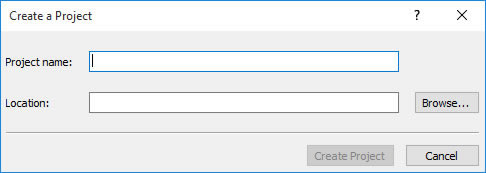
Choose File > New > Project... to display a dialog box similar to the following:

In the Project name field, type memory. Then click the Create project button to create a config.inspxeproj file in the ~/intel/inspxe/projects/memory/ directory (default location) and display a dialog box similar to the following:

Click the Browse... button next to the Application field and select the tachyon_insp_xe/tachyon.find_and_fix_memory_errors application. Notice the Intel Inspector autofills the project Working directory field for you. Then click the OK button to return to the Welcome page, where the name of the opened project displays in the title bar and in the Project Navigator pane. (If necessary, choose View > Project Navigator to display the Project Navigator.)