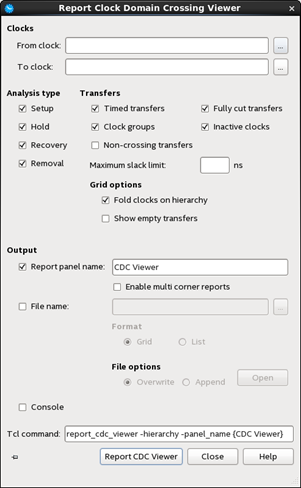
Report Custom CDC Viewer Command
 to keep the Report False Path, Report Timing, and Report Endpoints dialog boxes
open after you generate a report. You can use this feature to fine tune your report settings or quickly create additional reports. You
can click Close to close the dialog box at any time.
Filter boxes for filtering From Clock: and To Clock: values. Clicking on the buttons next to each box opens the Name Finder dialog box.
Analysis Type
The CDC Viewer can analyze any combination of Setup, Hold, Recovery, or Removal.
| Scripting Information |
|
Keyword: report_cdc_viewer Settings: -setup|-hold|-recovery|-removal |
Transfer Filtering
By default, all transfer types are included in CDC Viewer reports:
- Timed transfers—Passing or failing
- Fully cut transfers— Transfers where all paths are false paths.
- Clock groups
- Inactive clocks
You can use these options to narrow down which kinds of transfers to show, or by adding the desired transfer types as options: –timed, –fully_cut, –clock_groups, and –inactive. If none are specified, all transfer types are shown.
| Scripting Information |
|
Keyword: report_cdc_viewer Settings: -timed|-fully_cut|-clock_groups|-inactive |
By default, only clocks are shown are clocks that launch or latch paths that are launched or latched by clocks other than themselves. Turning on Non-crossing transfers shows clocks with transfers to or from themselves.
| Scripting Information |
|
Keyword: report_cdc_viewer Settings: -show_non_crossing |
If you specify a value in the Maximum slack limit box, only paths with slack less than the value are displayed. If this option is not included, paths of any slack value are included in the report.
| Scripting Information |
|
Keyword: report_cdc_viewer Settings: -less_than_slack |
Grid Options
In grid-formatted reports, the grid can be configured to display clocks as either a flat list or in a hierarchy where generated clocks are displayed as children of the clock they are derived from. Turn on Fold clocks on hierarchy to enable this nested display.
| Scripting Information |
|
Keyword: report_cdc_viewer Settings: -hierarchy |
By default, clocks that launch or latch to no paths are not shown in grid-based reports. You can show these clocks by turning on the Show empty transfers option.
| Scripting Information |
|
Keyword: report_cdc_viewer Settings: -show_empty |
Output
Allows you to specify where you want to save the report and how much detail you want in the report. You can select one or more of the following settings:
- Report panel name— Directs the Timing Analyzer to generate a report
panel with the specified name. The default report name is Report Timing.
Scripting Information Keyword: report_cdc_viewer
Settings: -panel_name<reportname>
- Enable multi-corner reports— Allows you to enable or disable multi-corner
timing analysis. This option is on by default.
Scripting Information Keyword: report_cdc_viewer
Settings: -multi_corner
- File name— Directs the Timing Analyzer to save the report to your local
disk as a text file with the specified file name. To save a report in HTML, end the filename with ".html".
Scripting Information Keyword: report_cdc_viewer
Settings: -file<filename>
- Format— Specifies that the generated report file is formatted as a list
of clock transfers rather than the default grid panel.
Scripting Information Keyword: report_cdc_viewer
Settings: -list
Under File options you can specify whether the Timing Analyzer overwrites an existing file (the default setting) or appends the content to an existing file.
Scripting Information Keyword: report_cdc_viewer
Settings: -append|-overwrite
- Console— Specifies whether the report appears as information messages in
the Console.
Scripting Information Keyword: report_cdc_viewer
Settings: -stdout