A newer version of this document is available. Customers should click here to go to the newest version.
Window: Summary - Platform Power Analysis
To access this window: Select the Platform Power Analysis viewpoint and click the Summary sub-tab in the result tab.
Use the Summary window to:
- Begin analyzing data collected by Intel SoC Watch.
- Review the overall statistics for the collected period.
- Understand the high-level indicators of energy inefficiency.
- View basic graphs of time spent in active and sleep states.
Platform Power Analysis viewpoint is available as part of energy analysis. Collecting energy analysis with Intel® SoC Watch is available for target Android*, Windows*, or Linux* devices. Import and viewing of the Intel SoC Watch results is supported with any version of the VTune Profiler.
Depending on the options selected when running the Intel SoC Watch collector and the operating system or platform on which the analysis was run, the Summary window provides the following statistics in the Platform Power Analysis viewpoint:
- Wake-ups/sec per Core
- Top 5 Frequencies
- Top 5 Causes of Core Wake-ups
- Top 5 Kernel Wakelocks
- Core Frequency Histogram
- Elapsed Time per Core Sleep State Histogram
- Elapsed Time per System Sleep State Histogram
- Elapsed Time per Graphics Device State Histogram
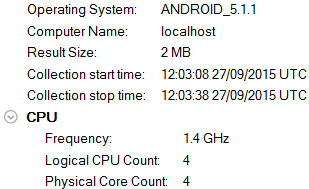
- Collection and Platform Information
After reviewing the information on the Summary window, switch to the Correlate Metrics window to view all timeline data on one window. The Correlate Metrics window is another method of identifying energy trends in the collected data.
Click the
 Copy to Clipboard button to copy the content of the selected summary section to the clipboard.
 Click the Details link next to the table or graph title on the Summary tab to view more information about that metric in another window of the Platform Power Analysis viewpoint.
Wake-ups/sec per Core
The Summary window displays a list of CPU sleep state metrics that help you estimate overall energy efficiency during collection. For a metric description, hover over the corresponding question mark icon  to read the pop-up help.
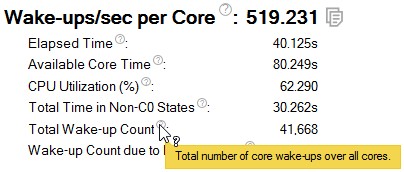
A wake-up is a shift from an inactive state (Cn) to an active state (C0).
Elapsed Time |
Total execution time for the collection. |
Available Core Time |
Total execution time across all cores (elapsed time X number of cores). |
CPU Utilization (%) |
Percentage of time spent in the active state (C0) during collection. A greater percentage time spent in the active state (C0) is an indication of higher energy consumption. |
Total Time in Non-C0 States |
Total time spent in sleep states (C1-Cn) across all cores. The larger the C-State number, the deeper the sleep state and the greater the energy savings. |
Total Wake-up Count |
Total number of wake-ups across all cores. A high number of wake-ups indicates that the device spent a lot of time switching from idle states to the active state. It is more energy efficient for the device to remain in either an active or inactive state than to continuously switch between idle states to the active state. |
Wake-up count due to <reason> |
Total number of wake-ups caused by a particular event type. For example, the total number of wake-ups caused by Clock Interrupt events. |
See Window: Core Wake-ups - Platform Power Analysis for more information.
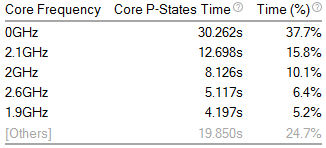
Top 5 Frequencies
View the total time and total percentage of time spent in each of the top 5 processor frequencies. The 0GHz frequency is time when the processor was inactive (in a sleep state). Switch to the CPU C/P States sub-tab to view more detailed information about core frequency. See Window: CPU C\P States - Platform Power Analysis for more information.
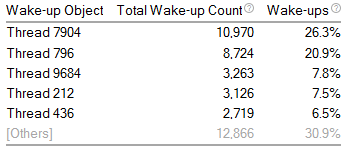
Top 5 Causes of Core Wake-ups
Identifies the objects that caused the cores to wake-up the most. Objects include system events such as a clock interrupt, or a particular thread. Switch to the Core Wake-ups sub-tab to view more detailed information about the number of core wake-ups and wake-up reasons. See Window: Core Wake-ups - Platform Power Analysis for more information.
Top 5 Kernel Wakelocks
Identifies the locking processes with the most wakelock counts and longest duration. Switch to the Wakelocks sub-tab to view more detailed information about the kernel wakelocks, locking processes, and locking threads. See Window: Wakelocks - Platform Power Analysis for more information.

Core Frequency Histogram
Graphical representation of the amount of time spent at each frequency. Hover over a bar to see the number of seconds the CPU executed in a frequency. More than one frequency value may be represented by a single bar. Increased time spent in the high-frequencies leads to higher power consumption. Switch to the CPU C/P States sub-tab to view more detailed information about core frequency. See Window: CPU C\P States - Platform Power Analysis for more information.
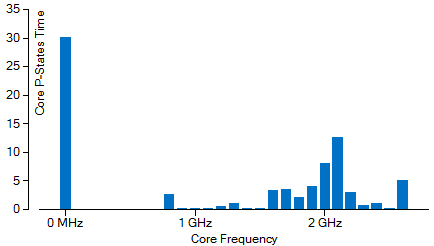
Elapsed Time per Core Sleep State Histogram
Graphical representation of the amount of time spent in each core sleep state (C-State). Hover over a bar to see the number of seconds the system spent in a specific sleep state.
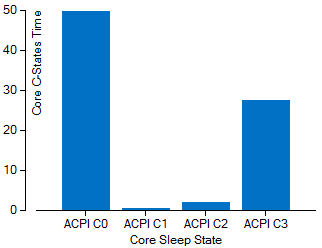
Cn represents the inactive or sleep state during which the device consumes the least energy. The larger the C-State number, the deeper the sleep state. A greater amount of time spent in the C0 or active state is an indication of higher energy consumption. Switch to the Core Wake-ups sub-tab to view more detailed information about the reasons the cores spent time in active states and to view a timeline indicating when the cores were active. See Window: Core Wake-ups - Platform Power Analysis for more information.
Elapsed Time per System Sleep State Histogram
Graphical representation of the amount of time spent in each system sleep state (S-State). Hover over a bar to see the number of seconds the system spent in a specific sleep state. Switch to the System Sleep States sub-tab to view more detailed information about the time spent in each state. See Window: System Sleep States - Platform Power Analysis for more information.
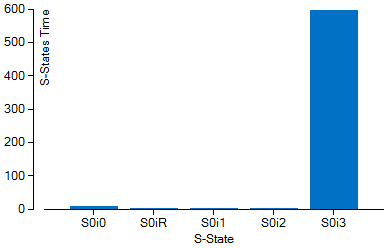
Elapsed Time per Graphics Device Sleep State Histogram
Graphical representation of the amount of time spent in each GPU sleep state (C-State). Hover over a bar to see the number of seconds your application executed in a specific sleep state. Switch to the Graphics C/P States sub-tab to view more detailed information about the time spent in each state, including graphics frequency changes over time. See Window: Graphics C\P States - Platform Power Analysis for more information.
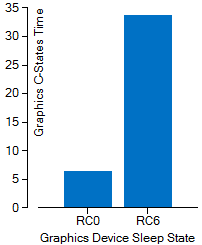
Collection and Platform Info
Provides basic details about the data collected (result size) and the device on which it was collected (operating system, CPU count, core count).
