Compare with Previous Result
Over the course of the Tutorial, you've applied multiple changes to improve the performance of the matrix sample application.
To get a detailed view of the performance improvement, you can use the Compare Results feature of Intel® VTune™ Profiler.
Compare Performance Before and After Optimization
You can compare results collected with VTune Profiler to better see the changes in performance.
While you can compare results from different analysis types (such as Hotspots and Performance Snapshot), only the metrics that are applicable to both analysis types simultaneously are shown.
To compare results:
Click the Compare Results button in the Main Toolbar.
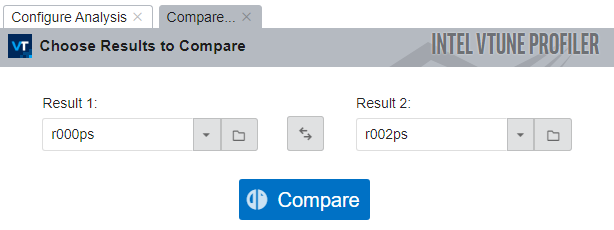
Select the results that you want to compare.

Click the Compare button.
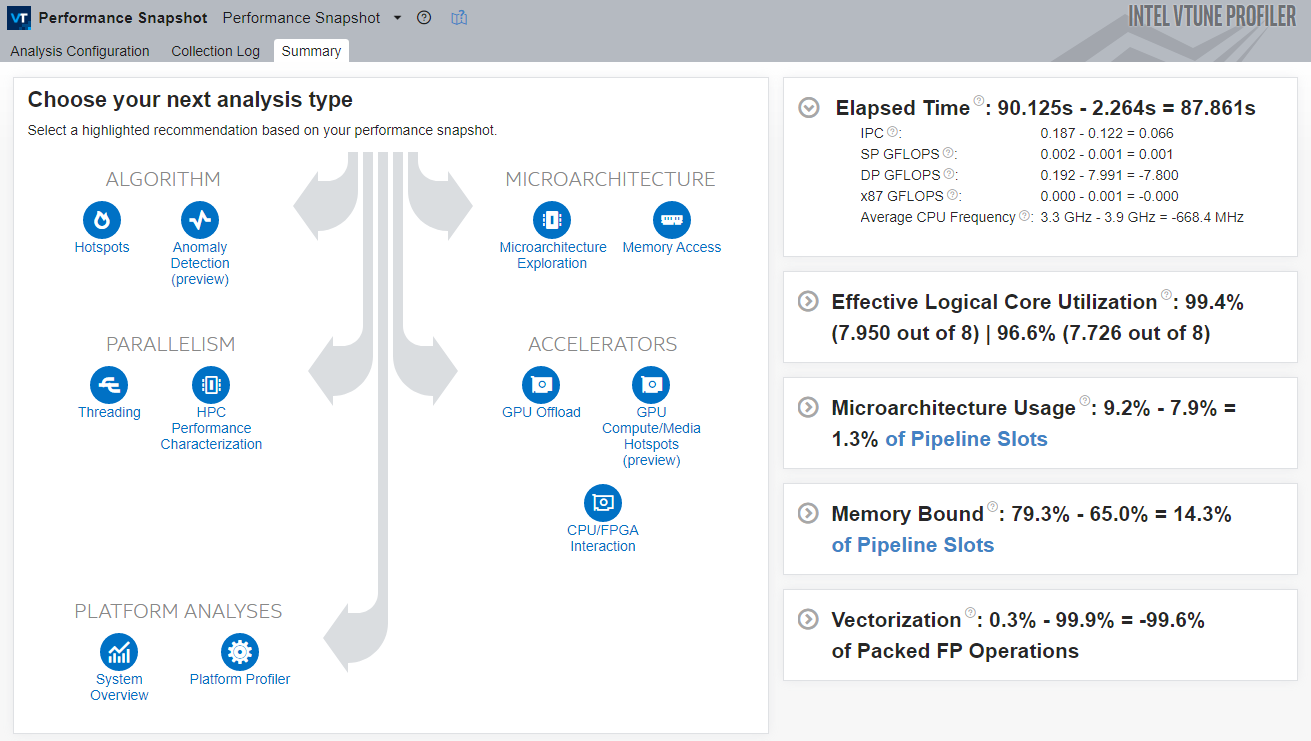
VTune Profiler profiler calculates the differences between metrics and opens the default Summary window.

You can expand any metric pane and see the difference between all metrics that are applicable to both results.
For example, for the matrix sample application, the Elapsed Time was reduced by almost 88 seconds.