Install on Windows* OS
Install Intel® VTune™ Profiler on a Windows system, either as a standalone application or as a component in the Intel® oneAPI Base Toolkit.
Before you Begin
Check Requirements:
Your host machine should use a 64-bit operating system. Once you install VTune Profiler, you can use the application to profile 32-bit and 64-bit applications.
Ensure that you are using supported versions of Windows and compilers. Check System Requirements.
Get Administrative Privileges
Administrative privileges are necessary for proper installation of the Sampling Drivers that are required for many analysis types in VTune Profiler. Having administrative privileges also makes it easier to install, change, or uninstall VTune Profiler.
Download VTune Profiler
Download Intel® VTune™ Profiler for Windows OS as:
Install VTune Profiler as a Standalone Application
On the download page for VTune Profiler,
Select between an Online or an Offline installer. An offline installer is better suited for systems without a stable internet connection.
Once the download completes, run the installer executable with Administrative privileges.
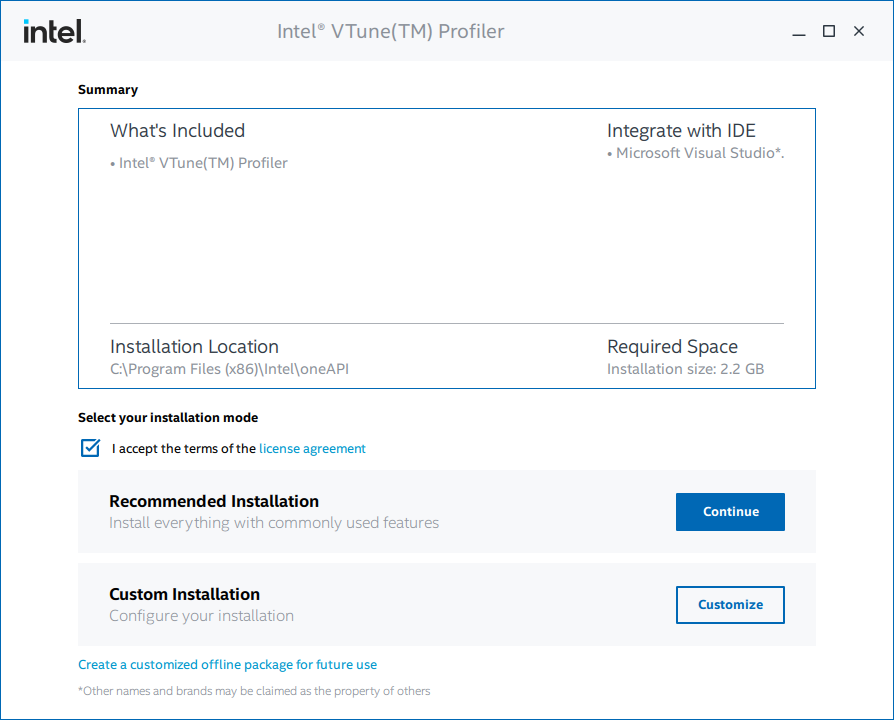
Select your preferred mode for the installation.

In the Recommended Installation mode, VTune Profiler installs in the default directory and integrates into your Microsoft Visual Studio* IDE.
In the Custom Installation mode, you can control these settings:
- Install directory: Specify a custom install directory. The default location is <Program Files (x86)>\Intel\oneAPI\vtune\
- Microsoft Visual Studio* IDE integration: Choose a version of Microsoft Visual Studio for integration, if necessary.
Follow subsequent steps in the installer to complete the installation.
Install VTune Profiler as a Component in the Intel® oneAPI Base Toolkit
On the download page for Intel® oneAPI Base Toolkit:
Select between an Online or an Offline installer. An offline installer is better suited for systems without a stable internet connection.
Once the download completes, run the installer executable with Administrative privileges.
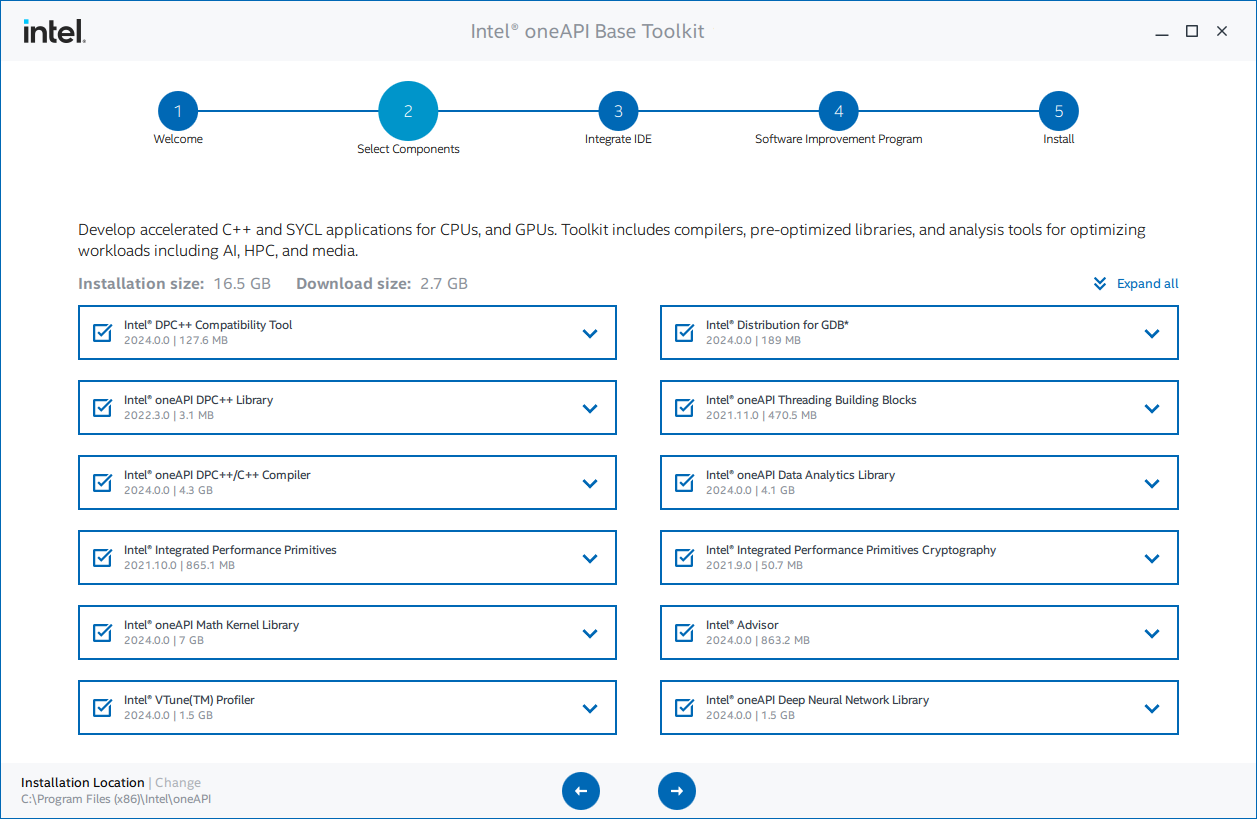
Select your preferred mode for the installation.
Choosing the Recommended Installation mode installs all components of the Intel® oneAPI Base Toolkit in the default directory. Appropriate components are then integrated into your Microsoft Visual Studio* IDE.
In the Custom Installation mode, you can control these settings:
- Components to install: Choose the toolkit components you want to install. The installer first checks for components that are already installed on your system (if any). You have the option to update or skip those components.
- Install directory: Specify a custom install directory. The default location is <Program Files (x86)>\Intel\oneAPI\
- Microsoft Visual Studio* IDE integration: Choose a version of Microsoft Visual Studio for integration, if necessary.

Follow subsequent steps in the installer to complete the installation.
After you Install VTune Profiler
To use the command line interface of VTune Profiler, set environment variables first. Run the vars.bat script:
C:\"Program Files (x86)"\Intel\oneAPI\vtune\latest\env\vars.batThe installation of VTune Profiler on your Windows system should also install the sampling drivers necessary for data collection in most analysis types. However, it is always good practice to verify this:
- Open the command prompt as an administrator.
- Go to the bin64 folder in your installation directory.
- Check to make sure your system meets the requirements for hardware event-based sampling (HEBS) collection. Run this command:
amplxe-sepreg.exe -c
- Check if the sampling drivers are loaded. Run:
amplxe-sepreg.exe -s
- If your system meets the requirements for HEBS collection and the sampling drivers are not installed, run this command to install the drivers with administrative privileges:
amplxe-sepreg.exe -i
For more information on installing the sampling drivers on a Windows system, see here.
To verify if you installed VTune Profiler correctly or troubleshoot issues with the installation, use the self-check script (vtune-self-checker.bat) available in the package. This script runs a set of analyses on a sample application, and reports the progress interactively.
Set environment variables.
Open a terminal window.
Go to this location: <Program Files (x86)>\Intel\oneAPI\vtune\latest\bin64
Run the vtune-self-checker.bat script:
vtune-self-checker.batThe self-check script may take several minutes to run all necessary checks.
Once the script completes all checks, review the summary. Check if any analyses failed, and see the log file for additional information.
When you install VTune Profiler on a Windows platform, you can use it to profile and collect data remotely from non-Windows targets, such as Linux* machines. For more information, see Set Up Analysis Target.
Learn More
- See guided examples in the Get Started Guide.
- Follow a comprehensive tutorial to Analyze Common Performance Bottlenecks
- Learn about analysis types, workflows, and command line use in the User Guide
- Browse through technical recipes that address typical use cases and challenges in the Performance Analysis Cookbook