Processor Cores Underutilization: OpenMP* Serial Time
Use this recipe to identify a fraction of serial execution in an application that was parallelized with OpenMP. Discover additional opportunities for parallelization, and improve the scalability of the application.
Content Expert: Rupak Roy
The presence of a fraction of serial time in a parallel application can limit the scalability of the application. Scalability is the capacity of the application to fully utilize available hardware resources like cores for code execution.
According to Amdahl's law, the maximum speed-up for a parallel application is given by:

where:
- P is a parallel portion of the application execution
- N is a number of processor elements
If the serial part (1-P) of the application execution is greater, this decreases the possibility of a linear speed-up. The serial portion limits the performance scalability.
When your application is parallelized with OpenMP, the sequential code execution may be a result of one of these code executions:
- The code executed out of the OpenMP regions.
- The code executed inside the #pragma omp master or #pragma omp single constructs.
This recipe focuses on the code executed out of OpenMP regions. In this recipe, use Intel® VTune™ Profiler to:
- Detect the serial time of the code executed outside of OpenMP regions
- Analyze the distribution of serial hotspot functions/loops
- Understand opportunities for code parallelization
DIRECTIONS:
Ingredients
This section lists hardware and software tools used for the performance analysis scenario.
Application: A miniFE Finite Element Mini-Application that is available for download from https://github.com/Mantevo/miniFE (OpenMP version)
Compiler: Intel® oneAPI DPC++/C++ Compiler 2024.0.0 or newer. This recipe relies on this compiler version to have necessary instrumentation inside Intel OpenMP runtime library used by VTune Profiler for analysis.
Performance analysis tools:
VTune Profiler version 2024.0 or newer - HPC Performance Characterization analysis
Intel® Inspector 2022.1: Threading Error analysis
NOTE:Get the latest version of Intel® Inspector from this download page.
Operating system: Linux*, Ubuntu* 20.04.6
CPU: 11th Gen Intel® Core™ i9-11900KB @ 3.30GHz
Create a Baseline
Use the openmp/src/Makefile.intel.openmp make file to build the application.
- To enable debug information, add the -g option.
- For simpler identification, you can see source file information in the names of the OpenMP regions by including the -parallel-source-info=2 compiler option.
- Run the compiled application with these parameters:
- nx=200
- ny=200
- nz=200
The number of OpenMP threads corresponds to the number of physical cores. With one thread running per core (OMP_NUM_THREADS=16, OMP_PLACES=cores), the application takes about 50 seconds.
This is a performance baseline. You use this baseline for further optimizations.
Run HPC Performance Characterization Analysis
To understand potential performance bottlenecks in the sample, run the HPC Performance Characterization analysis in VTune Profiler.
Click the New Project button on the toolbar and specify a name for the new project, for example: miniFE.
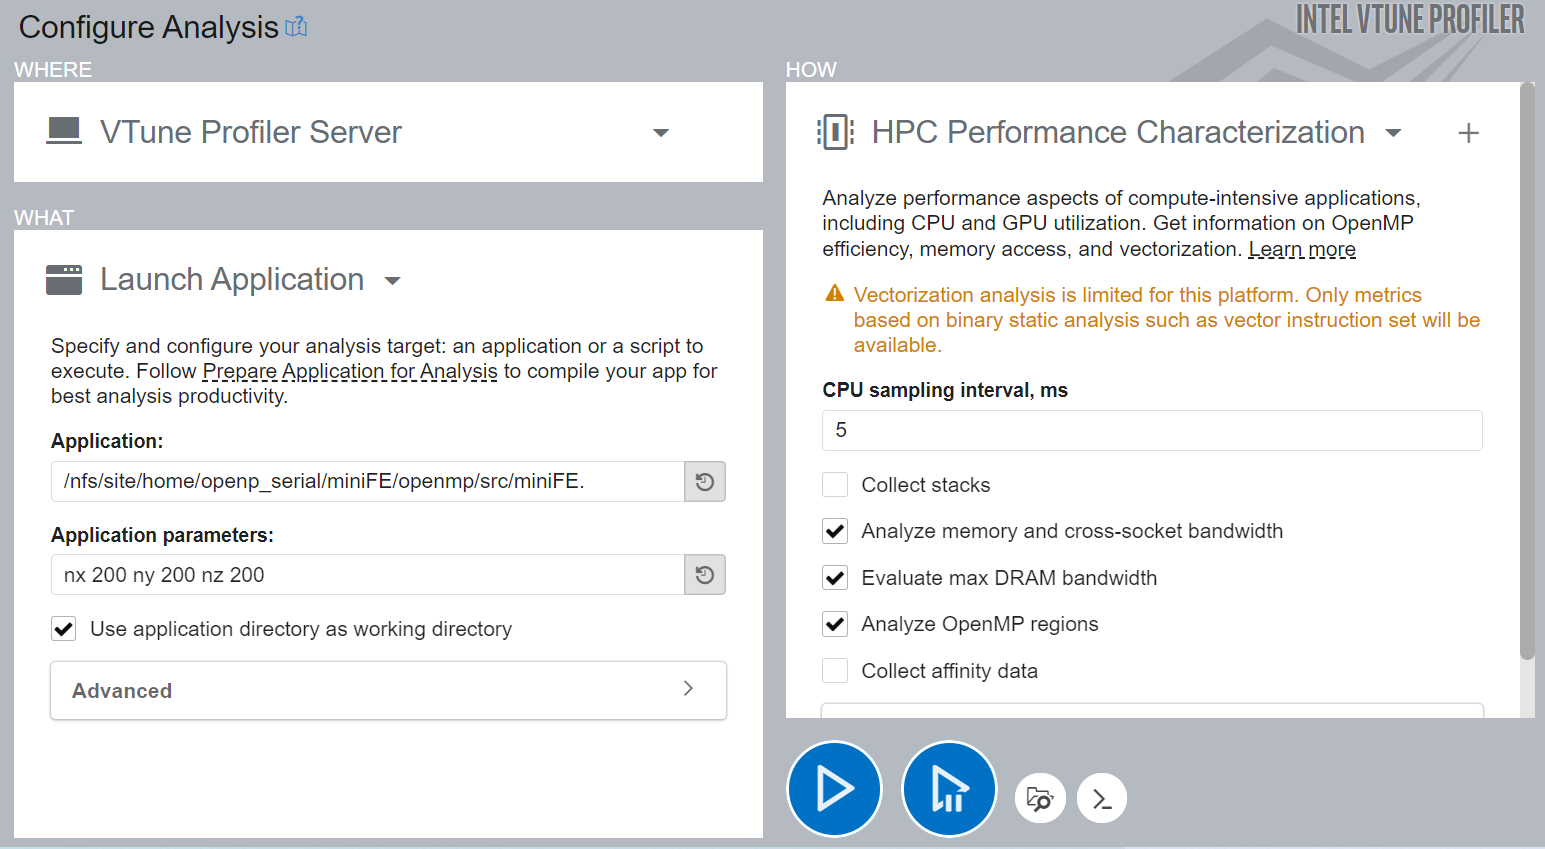
- In the Configure Analysis window, set these options:
In the WHERE pane, select the Local Host target system type.
In the WHAT pane, select the Launch Application target type.
Specify an application for analysis and use these parameters: nx 200 ny 200 nz 200.
In the HOW pane, from the Parallelism group, select HPC Performance Characterization .
Click the
 Start button to run the analysis.
To run the analysis from the command line, use this command:
Once data collection is complete, VTune Profiler processes the result and resolves symbol information. This is necessary for source analysis.
Identify OpenMP Serial Time
Using the HPC Performance Characterization analysis, you can see HPC metrics that help you to understand these performance bottlenecks:
- CPU utilization (parallelism)
- Memory access efficiency
- Vectorization
For applications which use the Intel OpenMP runtime, you can benefit from special OpenMP efficiency metrics that help identify issues with threading parallelism.
Start your analysis with the Summary view where you see application-level statistics. The Effective Physical Core Utilization metric has been flagged. This signals a performance problem that requires investigation:

When you dive deeper into the metric hierarchy, you see that the Serial Time (outside parallel regions) of the application occupies ~24% of its elapsed time.
Let us look at the serial hotspot in the matrix initialization code, which is the loop at line 133.
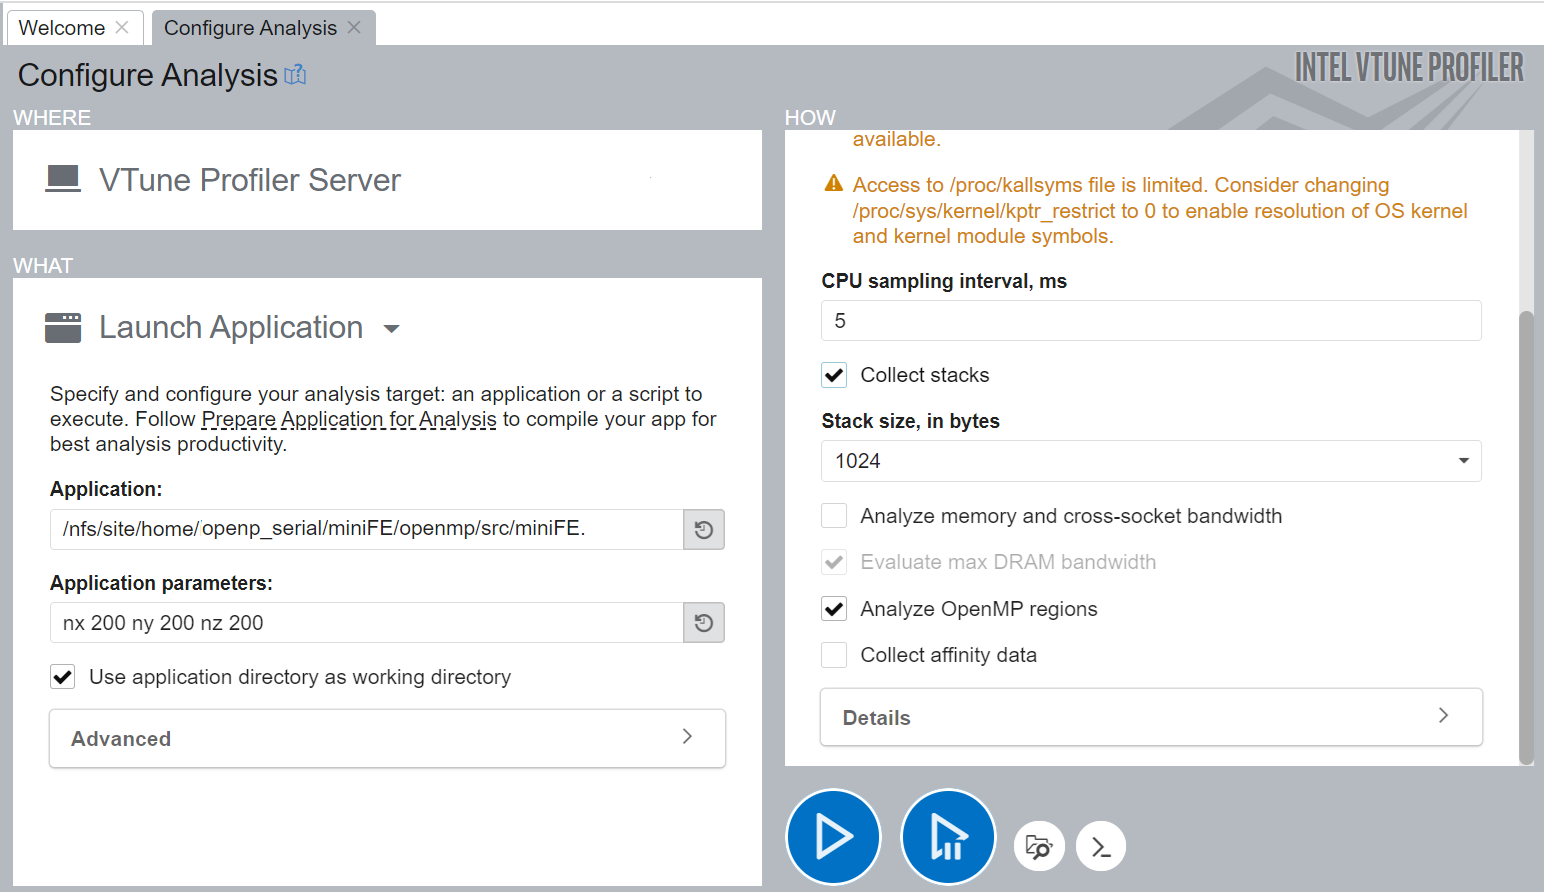
Consider running the HPC Performance Characterization analysis with call stacks to explore available optimization opportunities. Using call stacks can help you find a candidate for parallelism at a proper level of granularity. Since the call stack collection is not compatible with memory bandwidth analysis, make sure to disable the Analyze memory bandwidth configuration option first:

To run this analysis from the command line, use this command:
While you can also use the Threading analysis to analyze OpenMP Serial Time with stacks, the HPC Performance Characterization analysis is a better starting point for a high level understanding of performance bottlenecks.
Once the data collection finishes, VTune Profiler displays results starting with the Summary view. To identify top hot spots and see their call stacks, switch to the Bottom-up view.

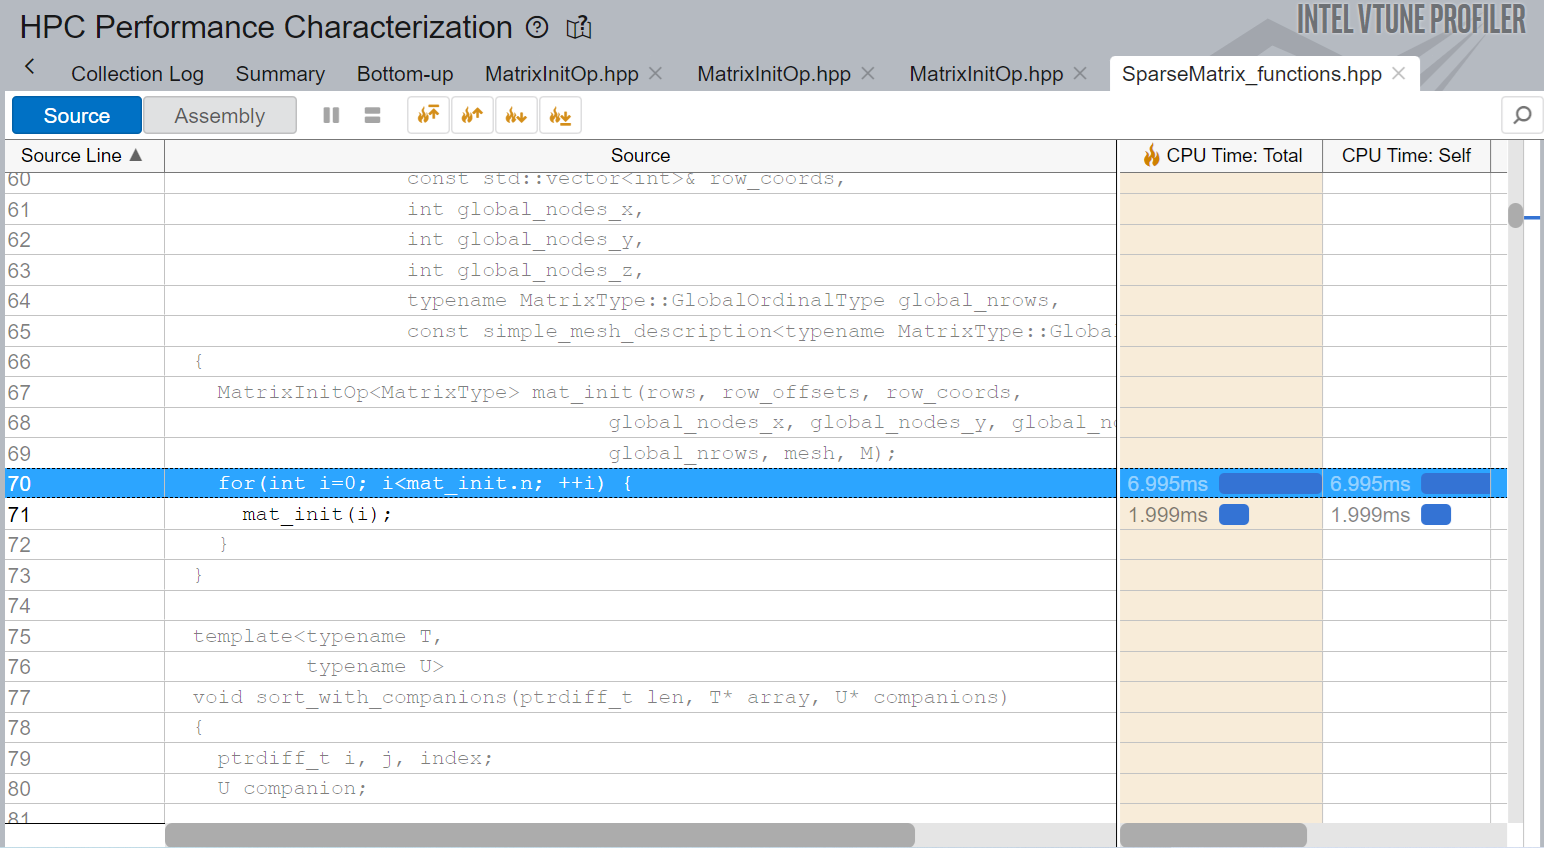
SparseMatrix_functions.hpp has a loop with iterations by matrix elements. This is a good location to insert parallelism.
Double click this row to open the source file at that location:

Parallelize the Code
To make the matrix initialization parallelized by OpenMP, insert the omp parallel for pragma :
Re-compile the application and compare the execution time versus the original performance baseline to verify your optimization.
In this recipe, the Elapsed time of the application after optimization is approximately 42 seconds, which is ~21% speed-up of the application execution.
Re-run the HPC Performance Characterization analysis for the optimized version of the application:

Overall,
- The Effective Physical Core Utilization has improved by 16%.
- The fraction of OpenMP Serial Time has reduced to 3.3%.
- VTune Profiler does not flag the OpenMP Serial Time metric since the threshold is 15%.
To further improve parallel efficiency, you can analyze the most imbalanced barriers. For more information, see OpenMP Imbalance and Scheduling Overhead.
Inspect Threading Errors
To complete your analysis for parallelism, check your code for threading errors like data races or deadlocks. Use Intel® Inspector to find potential data races and deadlocks that may not happen in particular hardware but can hurt in a different environment or even when the same environment uses different settings.
To speed up the check, use the command line interface and reduce the workload size:
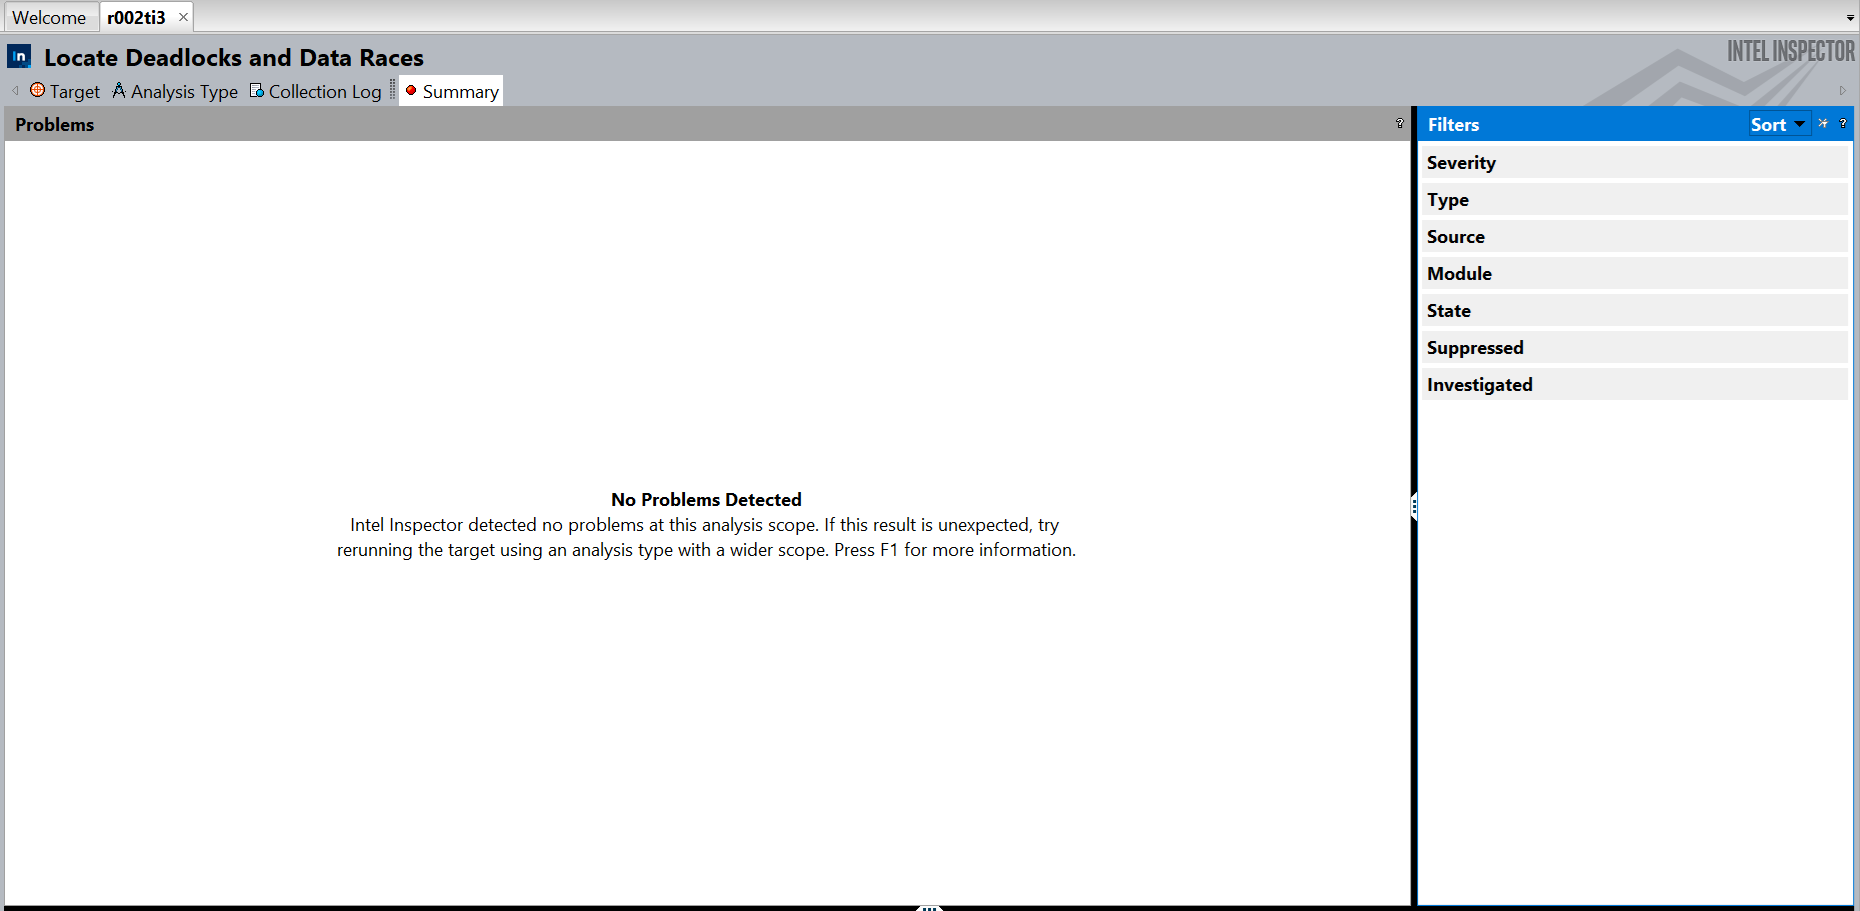
You see that the Intel Inspector does not report any issues for the parallelized code.

Discuss this recipe in the Analyzer forum.