Visible to Intel only — GUID: hxy1633471088092
Ixiasoft
1. Before You Begin
2. Introduction
3. Functional Description
4. Interface Overview
5. Parameters (H-Tile)
6. Parameters (P-Tile and F-Tile)
7. Designing with the IP Core
8. Software Programming Model
9. Registers
10. Troubleshooting/Debugging
11. Multi Channel DMA Intel FPGA IP for PCI Express User Guide Archives
12. Revision History for Multi Channel DMA Intel FPGA IP for PCI Express User Guide
3.1. Multi Channel DMA
3.2. Bursting Avalon-MM Master (BAM)
3.3. Bursting Avalon-MM Slave (BAS)
3.4. MSI Interrupt
3.5. Config Slave (CS)
3.6. Root Port Address Translation Table Enablement
3.7. Hard IP Reconfiguration Interface
3.8. Config TL Interface
3.9. Configuration Intercept Interface (EP Only)
3.10. Data Mover Only
4.1. Port List
4.2. Clocks
4.3. Resets
4.4. Multi Channel DMA
4.5. Bursting Avalon-MM Master (BAM) Interface
4.6. Bursting Avalon-MM Slave (BAS) Interface
4.7. MSI Interface (EP)
4.8. Config Slave Interface (RP only)
4.9. Hard IP Reconfiguration Interface
4.10. Config TL Interface
4.11. Configuration Intercept Interface (EP Only)
4.12. Data Mover Interface
4.13. Hard IP Status Interface
8.1.6.1. ifc_api_start
8.1.6.2. ifc_mcdma_port_by_name
8.1.6.3. ifc_qdma_device_get
8.1.6.4. ifc_num_channels_get
8.1.6.5. ifc_qdma_channel_get
8.1.6.6. ifc_qdma_acquire_channels
8.1.6.7. ifc_qdma_release_all_channels
8.1.6.8. ifc_qdma_device_put
8.1.6.9. ifc_qdma_channel_put
8.1.6.10. ifc_qdma_completion_poll
8.1.6.11. ifc_qdma_request_start
8.1.6.12. ifc_qdma_request_prepare
8.1.6.13. ifc_qdma_descq_queue_batch_load
8.1.6.14. ifc_qdma_request_submit
8.1.6.15. ifc_qdma_pio_read32
8.1.6.16. ifc_qdma_pio_write32
8.1.6.17. ifc_qdma_pio_read64
8.1.6.18. ifc_qdma_pio_write64
8.1.6.19. ifc_qdma_pio_read128
8.1.6.20. ifc_qdma_pio_write128
8.1.6.21. ifc_qdma_pio_read256
8.1.6.22. ifc_qdma_pio_write256
8.1.6.23. ifc_request_malloc
8.1.6.24. ifc_request_free
8.1.6.25. ifc_app_stop
8.1.6.26. ifc_qdma_poll_init
8.1.6.27. ifc_qdma_poll_add
8.1.6.28. ifc_qdma_poll_wait
8.1.6.29. ifc_mcdma_port_by_name
Visible to Intel only — GUID: hxy1633471088092
Ixiasoft
10.1.4.4. Eye Viewer
The Debug Toolkit supports the Eye Viewer tool that allows you to measure on-die eye margin.
The Eye Viewer tool:
- Provides a pictorial representation of the eye for each channel, both in the bifurcated (e.g., x8x8) and non-bifurcated (e.g., x16) configurations. This feature is available in P-Tile debug toolkit only.
- Provides information on the total eye height, total eye width and eye measurement information from the center of the eye to the four corners (left, right, top, bottom).
- Uses fixed step sizes in the horizontal and vertical directions.
- For P-Tile debug toolkit, Performs the eye measurement at the following bit error rates (BER):
- 8.0 GT/s (Gen3) @ e-8, 100% confidence level
- 16.0 GT/s (Gen4) @ e-9, 90% confidence level
- 8.0 GT/s (Gen3) and 16.0 GT/s (Gen4) @ e-12, 95% confidence level
- For F-tile debug toolkit, performs the eye measurement at BER = 1e-12, 95% confidence level.
Note: The Eye Viewer feature of the Debug Toolkit does not support independent error sampler for performing eye margining. The eye margining is performed on the actual data path. As a result, the eye margining may produce uncorrectable errors in the data stream and cause the LTSSM to go to the Recovery state. You may mask out all errors (example AER registers) while performing the eye margining and reset all error counters, error registers etc. after margining is completed.
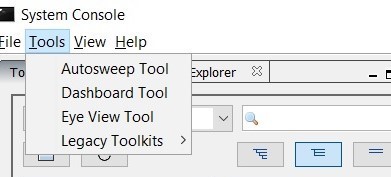
- In the System Console Tools menu option, click on Eye View Tool.
Note: The per-lane information under the Eye Viewer tab corresponds to the physical lanes.Figure 70. Opening the Eye Viewer
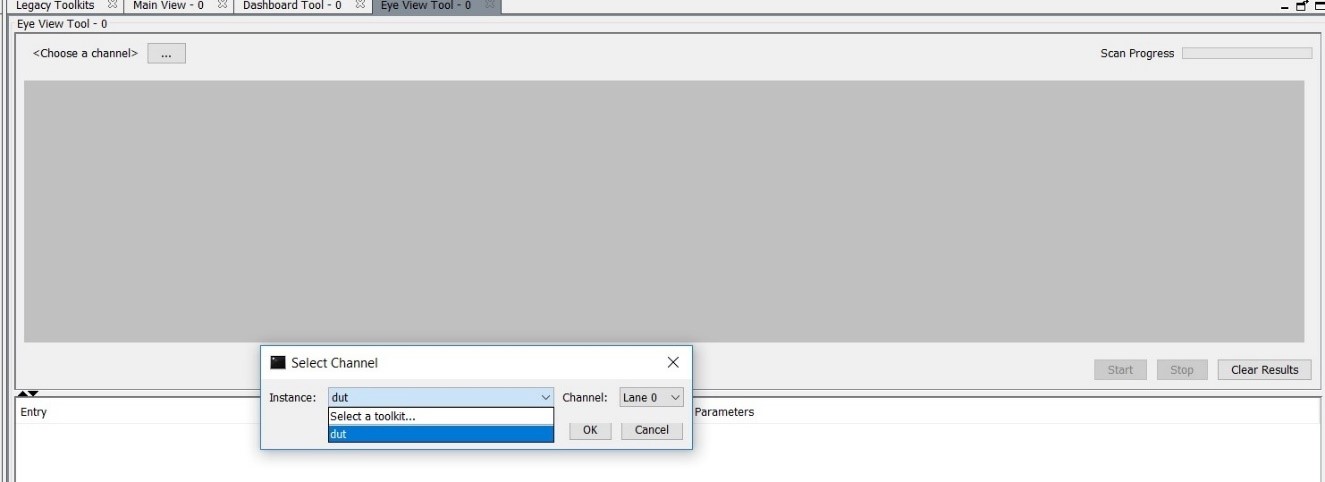
- This will open a new tab Eye View Tool next to the Main View tab. Choose the instance and channel for which you want to run the eye view tests.
Figure 71. Opening the Instance and Channel
- For P-Tile debug toolkit, set the Eye Max BER. Two options are available: 1e-9 or 1e-12.
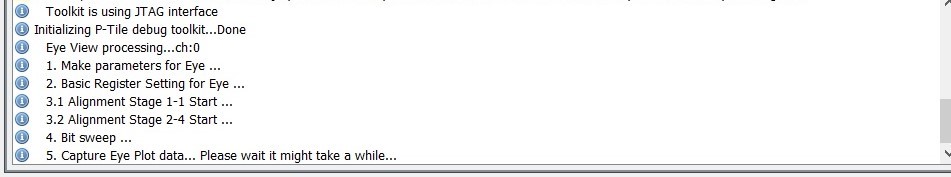
- Click Start to begin the eye measurement for the selected channel.
- The messages window displays information messages to indicate the eye view tool's progress.
Figure 72. Eye View Tool Messages
- Once the eye measurement is complete, the eye height, eye width and eye diagram are displayed.
Figure 73. Sample Eye Plot [for BER = 1e-9 in P-Tile debug toolkit]
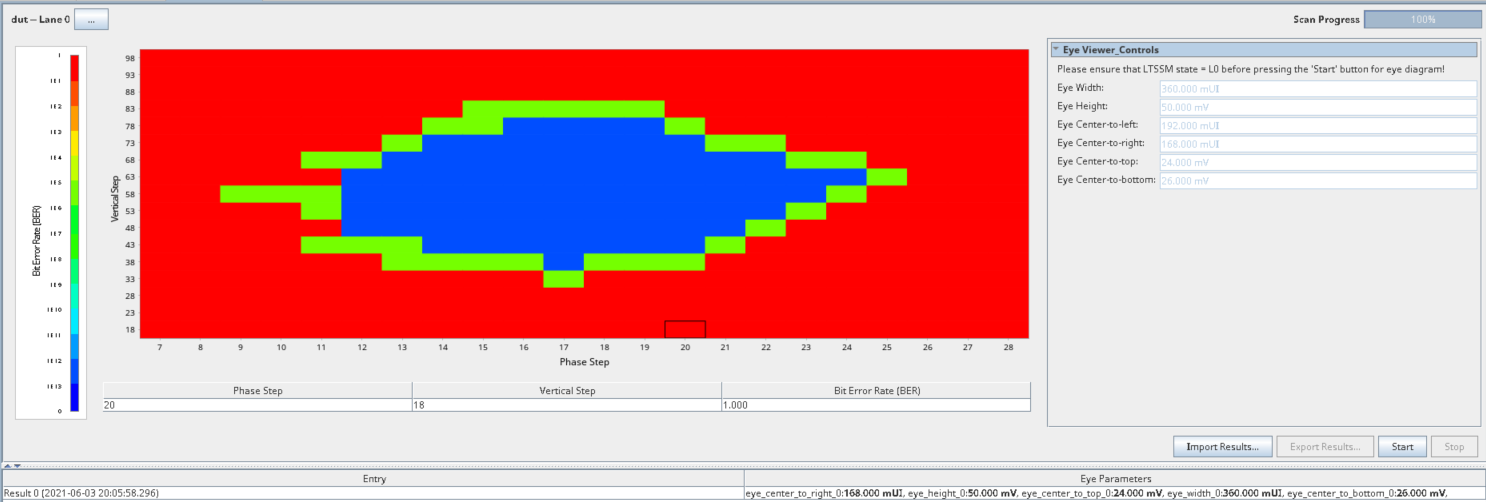 Figure 74. Sample Eye Plot [for BER = 1e-12 in P-Tile debug toolkit]
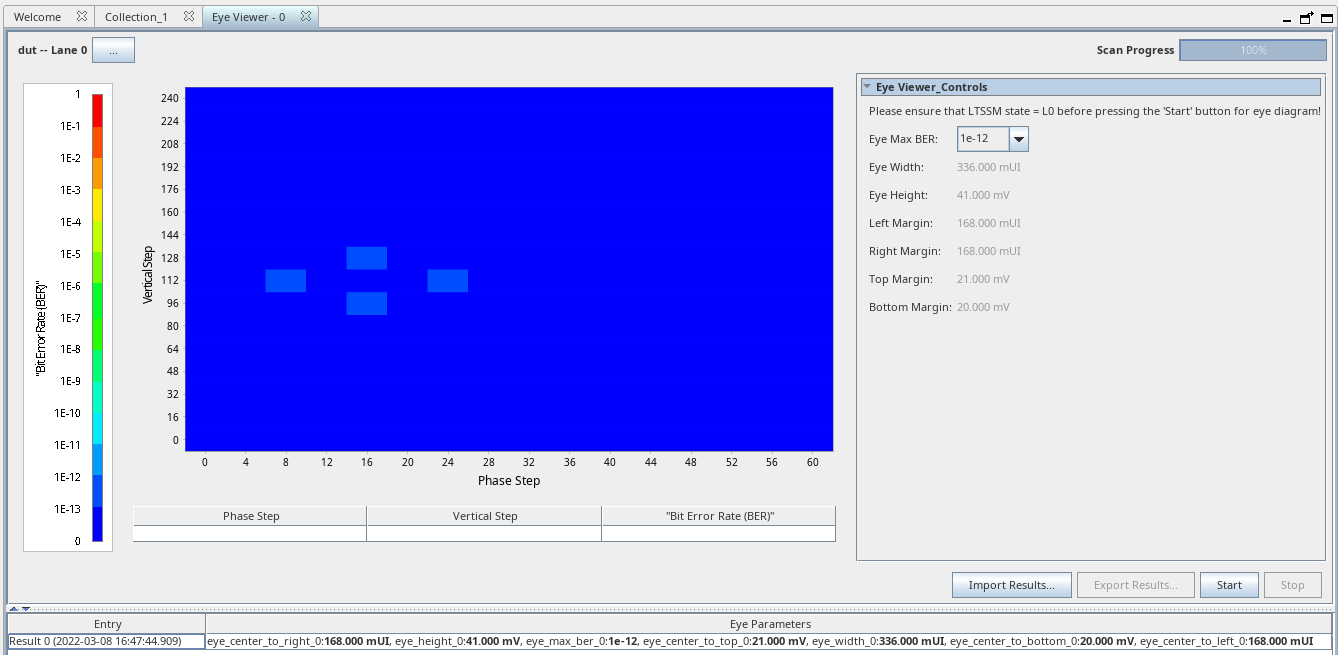 Note: Full eye plot is not drawn for BER = 1e-12.