Visible to Intel only — GUID: iuw1487905732553
Ixiasoft
Visible to Intel only — GUID: iuw1487905732553
Ixiasoft
6.2.3.4. Viewing Routing Congestion in Chip Planner
The Chip Planner offers a comprehensive visual representation of device resources, enabling in-depth analysis of routing and congestion. Through detailed routing information and congestion visualization, you can gain insights into resource utilization across the device. The "Report Routing Utilization Task" generates an accurate heatmap of routing resources utilized in the current compilation, facilitating the identification of areas experiencing routing congestion. This feature aids in making informed design modifications to alleviate congestion and ensure adherence to routing requirements.
To access the Chip Planner window from the Quartus GUI, navigate to Tools > Chip Planner.
- In the Chip Planner window, double-click the Report Routing Utilization command in the Task list.
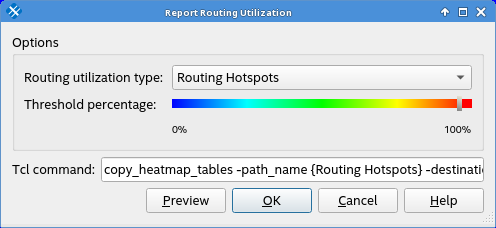
- In the Report Routing Utilization dialog box, you have the following options for viewing the heatmap:
- Click Preview.
Clicking Preview shows you the utilization heatmap as long as the Report Routing Utilization dialog box remains open.
The heatmap does not persist as a report when you close the dialog box.
For convenience, you can click Preview when you want to quickly check routing utilization and then cancel out of the dialog box without generating a persistent report.
- Click OK
Clicking OK generates the utilization heatmap as a persistent Chip Planner report that you can select and deselect.
A persistent heatmap report is useful when you want to review the routing utilization report multiple times in an Chip Planner session.
- Click Preview.
- Change the Routing utilization type to display congestion for specific resources.
Resource Type Report Description Routing hotspots (default) Shows a heatmap that combines the maximum congestion at each device location, regardless of what wire type is associated with the maximum congestion. Use the report for this resource type to quickly identify all areas of the device that have high routing utilization.
Individual wire type Select individual wire types to figure out how much routing congestion is associated with each wire type. Long wires Areas of congestion in the longest wire types are often associated with timing critical paths.
When registers are placed far apart, they may require long routing wires to connect them with a chance of meeting the timing requirement.
When parts of a design are insufficiently pipelines, the long wires tend to be used up quickly because there are fewer long wires than short wires.
Short wires Areas of congestion are less common in short wires because there are more of them. However, areas of congestion in short wires can indicated highly interconnected logic or extremely highly utilized areas of the device. - Adjust the slider for Threshold percentage to change the congestion threshold level.
A good starting point for your analysis is a threshold value in the range of 90-95% . If utilization is below that threshold (that is, no areas of pink in the utilization report), timing failures are unlikely being caused by routing congestion.
Areas of high routing utilization do not necessarily correlate with timing failures, but they are a good place to check against timing failures.

The default display uses dark blue for 0% congestion and red for 100%.

To identify potential routing resource shortages, it's essential to examine each routing interconnect type individually from the drop-down list in the Routing Utilization Settings dialog box. Typically, peak interconnect usage exceeding 75%, or average interconnect usage surpassing 60%, may suggest challenges in accommodating your design. Moreover, peak interconnect usage above 90%, or average interconnect usage beyond 75%, indicate heightened risk of encountering fitting issues.