Threading Error Analysis Use Case
Intel® Inspector is a dynamic memory and threading error checking tool for users developing serial and multithreaded applications on Windows* and Linux* operating systems. This topic is part of a tutorial that shows how to find and fix threading errors using the Intel Inspector and a Fortran sample application.
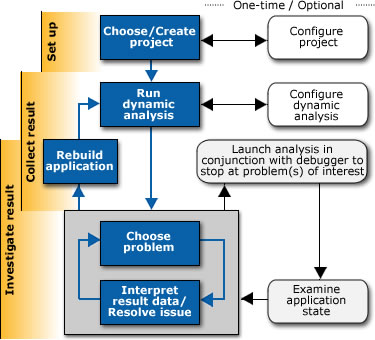
There are many ways to take advantage of the power and flexibility of the Intel Inspector. The following workflow, which shows how to find and fix threading errors in parallel programs, is one way to help maximize your productivity as quickly as possible.

This tutorial implements this workflow in the following manner:
Step 1: Unpack and set up sample for analysis |
Do one of the following:
|
Step 2: Collect result |
|
Step 3: Investigate result |
|
Step 4: Check your work |
Rebuild the application and rerun the threading error analysis. |