Visible to Intel only — GUID: GUID-9FE4D73A-78C2-42CB-877F-429EFDA179E8
Introduction to Intel® Graphics Performance Analyzers
Game Optimization Methodology
Install and Launch Intel® GPA
Launch Application for Analysis
Configure Analysis Settings
Analyze Desktop Graphics Applications
Quick Start with Profiling Unreal Engine* Games
Instrumentation and Tracing Technology API Support
Intel® GPA Reference
Notices and Disclaimers
Visible to Intel only — GUID: GUID-9FE4D73A-78C2-42CB-877F-429EFDA179E8
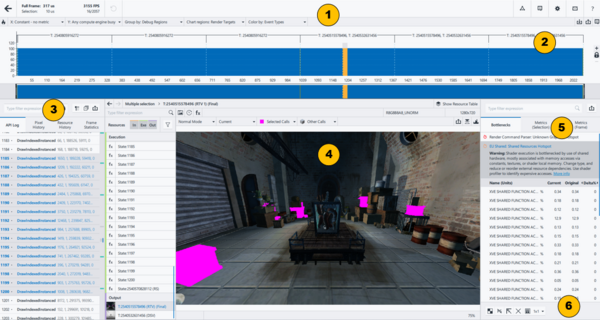
Profiling View
Use Profiling View to identify potential performance bottlenecks and possible improvements in your application by performance quick 3D pipeline experiments.
You can access the Profiling View window in several ways:
Select the frame for analysis in the Open Frame Capture window and click Open
Select a frame in the Open Frame Capture window and double-click on the frame preview
Select a frame or a frame sequence in Multiframe View and click Open
|
Main Toolbar Displays the opened frame data, notifications, opens the Intel® GPA Online Help, restores the default view, and changes the Intel® GPA color scheme. |
|
Visualization pane Displays the sequence of captured events in a graphical format based on GPU metrics. |
|
API Log pane Displays the list of all graphics API functions used in the frame in the GPU execution order and parameters of each function. |
|
Resources pane Displays all resources used by the selected graphics API functions. |
|
Metrics pane Displays metrics information for the selected graphics API functions. |
|
Experiments pane Discovers potential performance bottlenecks in your application by modifying render states of the graphics API. |