Trace Analysis: Analyze Application Execution on the CPU and GPU
Use Intel® GPA Graphics Trace Analyzer to:
Evaluate CPU and GPU workload to identify whether the bottleneck on the CPU or GPU side.
Identify problem areas in graphics application execution: analyze calls to graphics APIs, review user-defined debug markers, threads, queued GPU commands.
Perform a high-level analysis of synchronization and parallelism efficiency.
To start trace analysis:
Run Graphics Monitor by double-clicking the
 Graphics Monitor icon in the taskbar notification area or on the desktop.
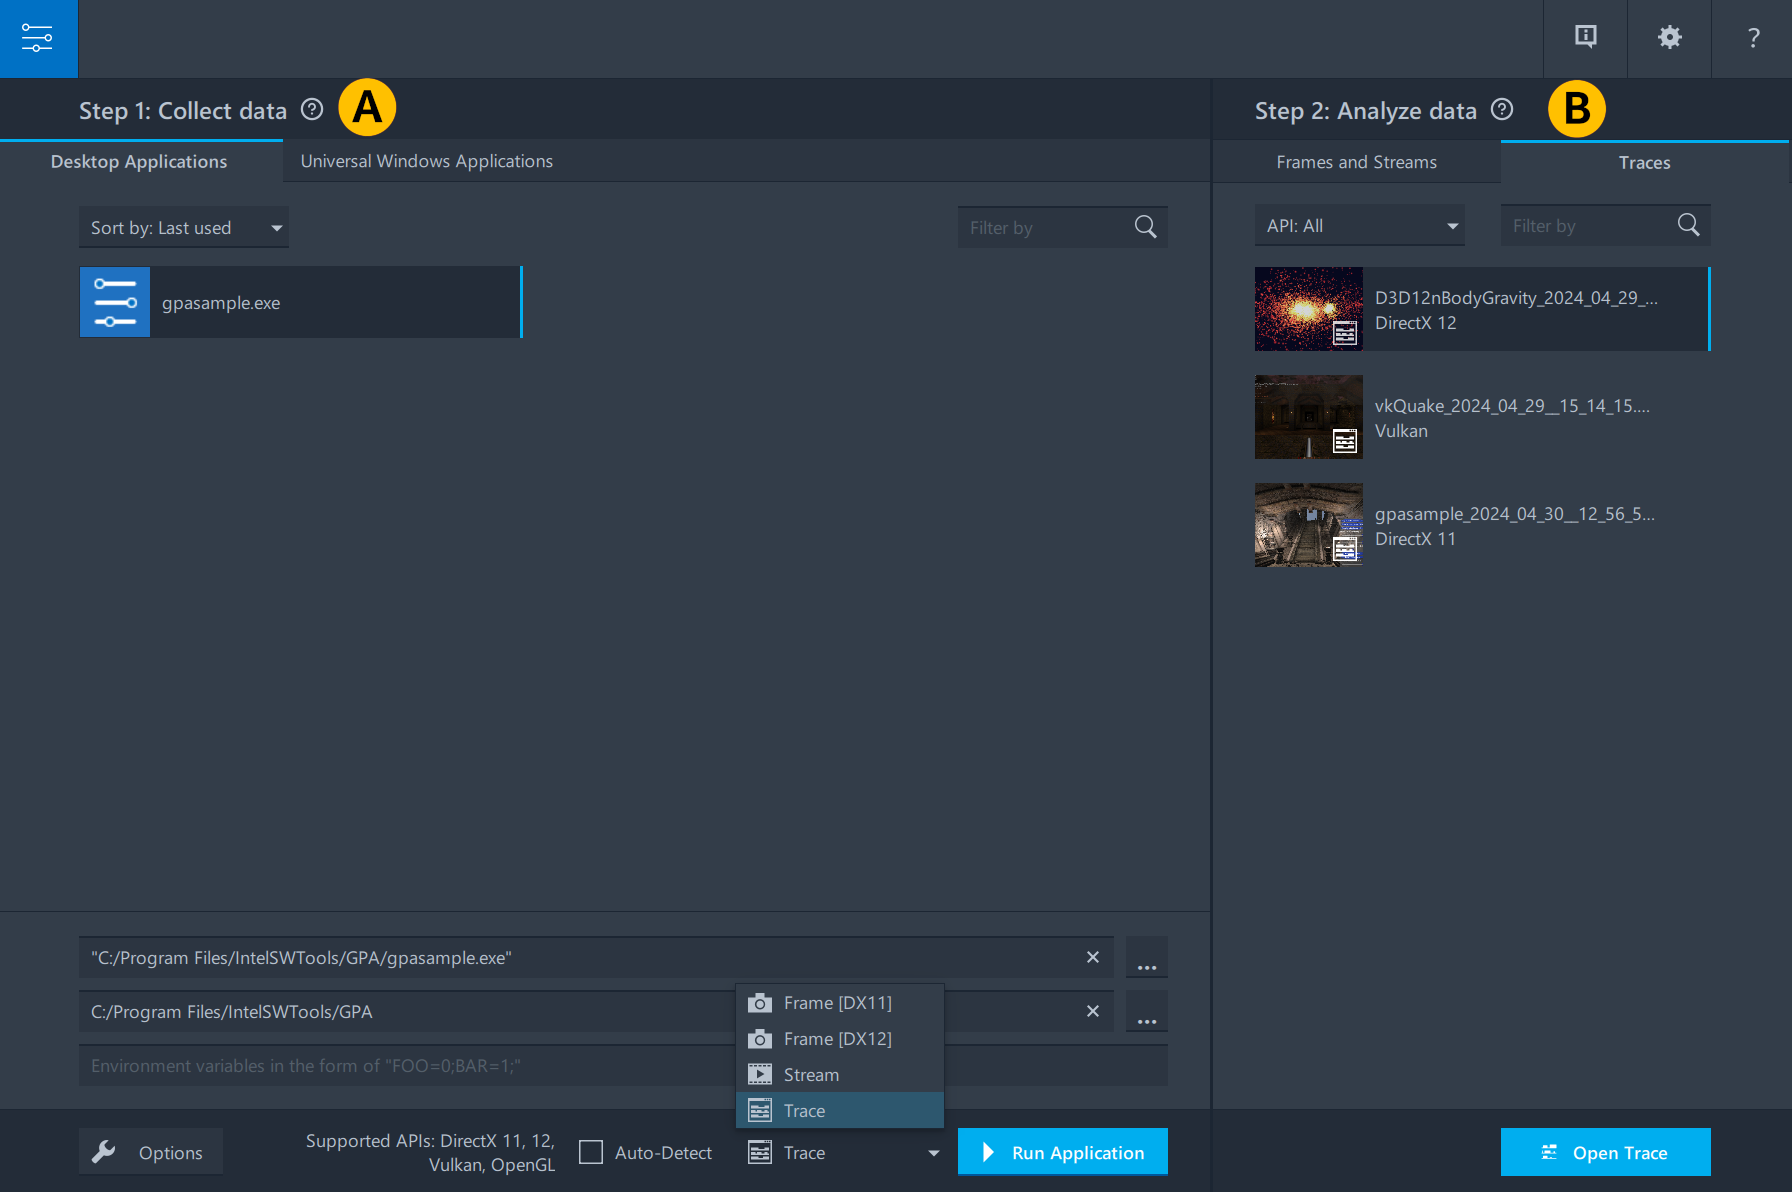
Follow Step 1 to collect data (
 ):
):A.1. Select a data collection type:
Select the Trace startup mode to capture a trace.
A.2. Select an application for analysis:
Specify the application for analysis by clicking the Browse
 button on the lower right and browsing to your application. Alternatively, select a previously launched application from the application history.
A.3. Run the application by clicking the Run Application button.
The application launches in a separate window. Capture a trace by pressing Ctrl+Shift+T in the window with the target application running. When the capture is complete, a message with the file name displays.
NOTE:Hotkeys may interfere with game keyboard usage. In this case, you can customize shortcuts.NOTE:You can get the additional information by clicking the icon.
icon.
Follow Step 2 to analyze data (
 ):
):B.1. Select the Traces tab
B.2. Open the collected data by double-clicking the Preview image or by clicking Open Trace button.

Platform View of Trace Analyzer opens.
Perform a high-level analysis to identify whether the bottleneck is on the GPU side.
You can identify a GPU-bound game by the following criteria:
All frames are longer than expected. Expected frame duration depends on performance goals. For example, if your goal is 60 FPS, frame duration should be approximately 16 milliseconds.
The frame duration is measured in milliseconds and shown in curly braces for each frame in the CPU Frames track.

The GPU is busy the entire time and the GPU queue (3D track) has no visible gaps.
The Driver queue (Device Context track) continuously accumulates command buffers waiting for execution on the GPU.

CPU threads are inactive most of the time.
The thread activity zone above the CPU thread track contains green or grey intervals. Colors indicate whether the thread was active or inactive during a particular period.

Once step 7 is done, close Graphics Trace Analyzer window.
As a result, you can identify whether your application is “bottlenecked” by the GPU. In this case, you need to analyze the graphics pipeline in detail to find optimization possibilities.
Next Steps
If the game is GPU-bound, analyze the graphics pipeline with Graphics Frame Analyzer.
If the game is not GPU-bound:
Analyze synchronization and parallelization with Graphics Trace Analyzer:
To learn more about trace analysis workflow, refer to the user guide section Identify Issues in Graphics Application Execution with Trace Analyzer.
To take a closer look at the features of Graphics Trace Analyzer, watch short video series In Depth: Graphics Trace Analyzer.
Analyze CPU-bound issues with Intel® VTune™ Profiler.