System Analysis: Analyze Your Game Performance in Real Time
Use Intel® GPA System Analyzer to view CPU, GPU, and graphics API metrics in real time to determine problem scenes of the application.
Problem scenes are when the game is slow to render specific objects, textures, new locations. Imbalanced CPU and GPU workload also indicates performance issues. For example, do not have the GPU running at 100% while the CPU is only 20% utilized, and vice versa.
To start system analysis:
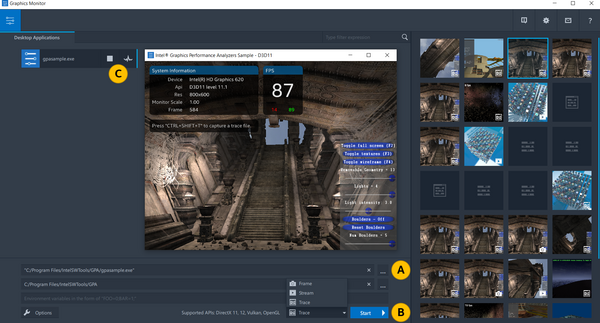
Run Graphics Monitor by double-clicking the
 Graphics Monitor icon in the taskbar notification area or on the desktop.
Specify the application for analysis by clicking the
 Browse button on the lower right and browsing to your application (
  ).
).On Windows, you can use a sample application gpasample.exe.
Run the application by clicking the Start button (
 ).
).The analyzed application launches in a separate window with heads-up-display (HUD) overlay on the top left. HUD shows system information and frame rate, with the lowest value shown in red and the highest shown in green.
Return to the Graphics Monitor and click the
 Connect System Analyzer button next to your application (
  ).
).System Analyzer opens and attaches to your application.

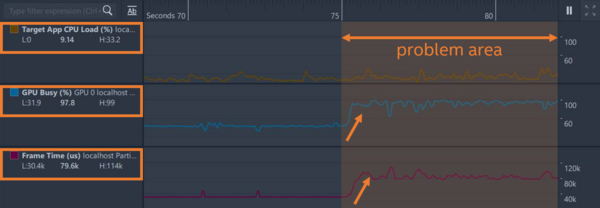
Identify the problematic area for further detailed analysis using real-time metrics. For example, detect scenes, where:
Frame rendering takes too long: analyze the Frame Time metric.
CPU and GPU workload is imbalanced: evaluate CPU and GPU load by analyzing GPU Busy and Target App CPU Load metrics.

Once step 5 is done, close System Analyzer window.
As a result, you can find an area that potentially has performance issues. If you haven’t found a particular problem scene with System Analyzer, proceed with trace analysis or frame analysis to identify areas for performance improvements.
Next Steps
Identify whether your game is GPU- or CPU-bound in the determined scene, with Graphics Trace Analyzer.