Platform-Based Graphics Performance Analysis
Increasing performance of graphics processors boosts the image rendering level of realism. The more powerful GPUs become, the more resource-demanding graphics can be created. Game makers try to gain all available advantages of modern GPUs and often face graphics performance issues.
Usually talking about game graphics, developers assume a scene in a game world with objects rendered by a bunch of graphics commands forming a final frame. This final frame is an output image that users see on a screen. A number of frames rendered per second (FPS) is a common metric for measuring overall game performance. A reasonable frame rate depends on a game plot. A dynamic game, such as a first person shooter, usually requires a higher FPS rate than a step-by-step strategy.
If FPS drops below a desired level it is necessary to identify bottlenecks in software or hardware that limit the game performance. Modern games are complex applications not only in terms of graphics. Slow graphics is not always a result of bottlenecks in the GPU part of a game. CPU can impact a game and indirectly a graphics performance too. That is why identifying whether your application is CPU-bound or GPU-bound can be tricky.
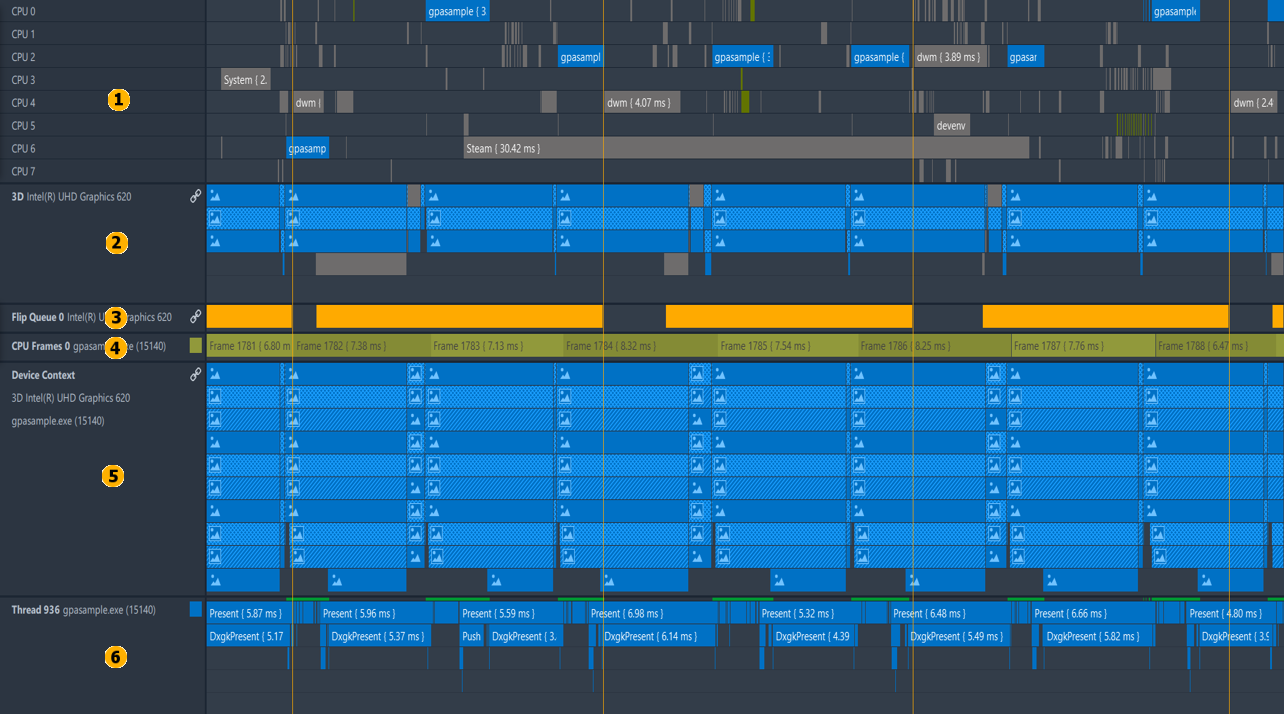
Intel® GPAGraphics Trace Analyzer gives a high level granularity insight into the execution flow of a running graphics application. Graphics Trace Analyzer shows performance events generated by the system kernel and drivers, and application events specified by a user through debug API events and Instrumentation and Tracing Technology (ITT) markers provided by Intel® GPA .
Once you open a captured trace in the Graphics Trace Analyzer, you can explore the following critical tracks for performance analysis:

|
Thread Activity |
Shows how threads from different processes including your profiled application have been executed. |
|---|---|---|
|
Hardware GPU queue |
Shows how GPU executes commands forming a frame buffer you see on the screen. |
|
Flip queue and VSYNC events |
Shows work performed by a display manager. |
|
CPU frames |
Shows the range containing graphics commands between two successive frames buffer swap calls. |
|
Driver CPU queue |
Shows a how many graphics commands are scheduled by a graphics driver for being executed by the GPU. |
|
Debug and ITT events and markers |
Shows the result of user-defined instrumentation of profiled application matched with performance data generated by the system. |
Each Graphics Trace Analyzer track shows specific performance events generated by your application and system at subsequent stages of graphics command execution:

To start platform-based graphics performance analysis, use Hardware GPU queue, Flip queue and Driver CPU queue tracks to quickly define whether your application is GPU-bound or CPU-bound. Thread Activity track, CPU frames track and Debug and ITT events track can be used for a detailed analysis of CPU-bound scenarios.