Performance Optimization for Intel® Processor Graphics
Performance Optimization for Intel® Processor Graphics is a series of recipes to help you determine and optimize performance bottlenecks in graphics applications.
Methodology
Use the series of recipes to learn how to use the Intel® GPAGraphics Frame Analyzer on Intel® Processor Graphics to profile your code efficiently and to find bottlenecks in the graphics pipeline.
Ingredients
To optimize performance of graphics applications on Intel® Processor Graphics with Intel® GPA, you need the following:
Tool:Intel® Graphics Performance Analyzers
NOTE:To download a free copy of the Intel® Graphics Performance Analyzers toolkit, visit the Intel® GPA product page.Operating System: Windows*
GPU:Intel® Processor Graphics Gen6 - Gen11
API: DirectX* 11/12, Vulkan*, OpenGL*
How to Start Analysis
To get started with your analysis:
Launch the Intel® GPAGraphics Monitor on your target system.
Capture a sample frame or stream (for Vulkan) from your game with the Intel® GPA Heads-Up Display (HUD).
NOTE:It is recommended to analyze performance with the latest driver and version of Intel® GPA.Open the captured frame with the Intel® GPAGraphics Frame Analyzer.
NOTE:For Vulkan, open the captured stream in the Multiframe View, and then select a frame to open with Intel® GPAGraphics Frame Analyzer.Click the
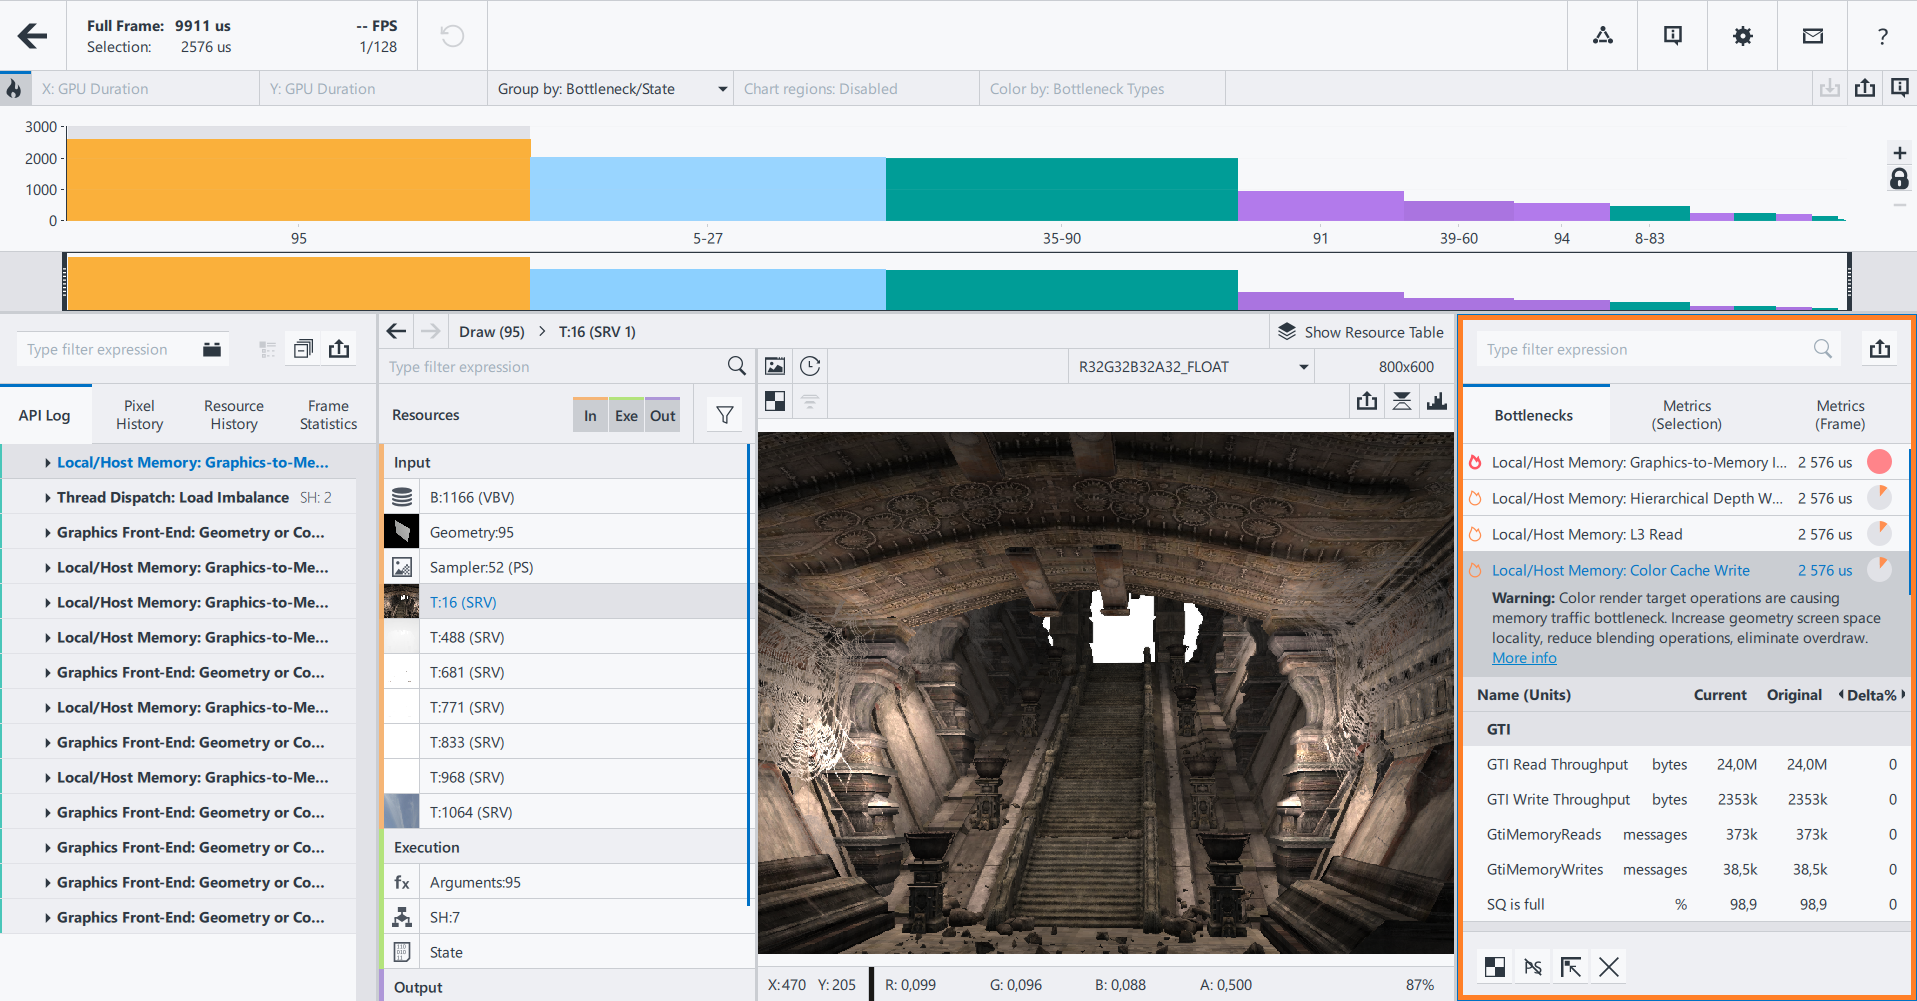
 button to enable the Advanced Profiling mode, and then select any event or group of events for further analysis.
In the normal mode you can manually select one event or a contiguous range of events. To properly observe graphics architecture, the selected events should meet the following conditions:
Total cycle count of all selected events is ≥ 20,000.
Check the GPU Core Clocks, cycles metric.
There are no state changes between the events, such as shader changes, pipeline state, and so on Texture and constant changes are exempt from this rule, unless the texture is a dynamically-generated surface.
Events share the same render, depth, and stencil surface. This is not an explicit check in Intel® GPA.
If you select a set of events that do not meet the above conditions, these events will be considered filtered events, and the analysis will not be conducted. When using metrics analysis techniques like this, do not have any state change within the selection. For example, if you measure two draw calls where one has a depth attachment and the other does not, any potential hotspot associated with depth would be averaged out over the two draw calls—effectively diluting the results.
How Graphics Frame Analyzer Identifies Bottlenecks Using Hardware Metrics
Once the selection is made, Intel® GPAGraphics Frame Analyzer playbacks the frame on your GPU, collects performance data, and highlights graphics architectural blocks with bottlenecks.
Red hot spot icon next to the hardware block name means that this part of the GPU pipeline is the primary bottleneck. Orange means that the node is not a primary bottleneck, but does have performance optimization opportunities.

Each of the metrics blocks in the Intel® GPAGraphics Frame Analyzer Metrics pane is mapped based on the graphics processing unit workflows. Intel® Processor Graphics performs deeply pipelined parallel execution of the front-end work and the back-end work within a single event. The front-end work includes geometry transformation, rasterization, early depth/stencil, etc. The back-end work includes pixel shading, sampling, color write, blend, and late depth/stencil. Due to the deeply pipelined execution, hotspots from downstream architectural blocks bubble up and stall upstream blocks. This can make it difficult to find the actual hotspot.
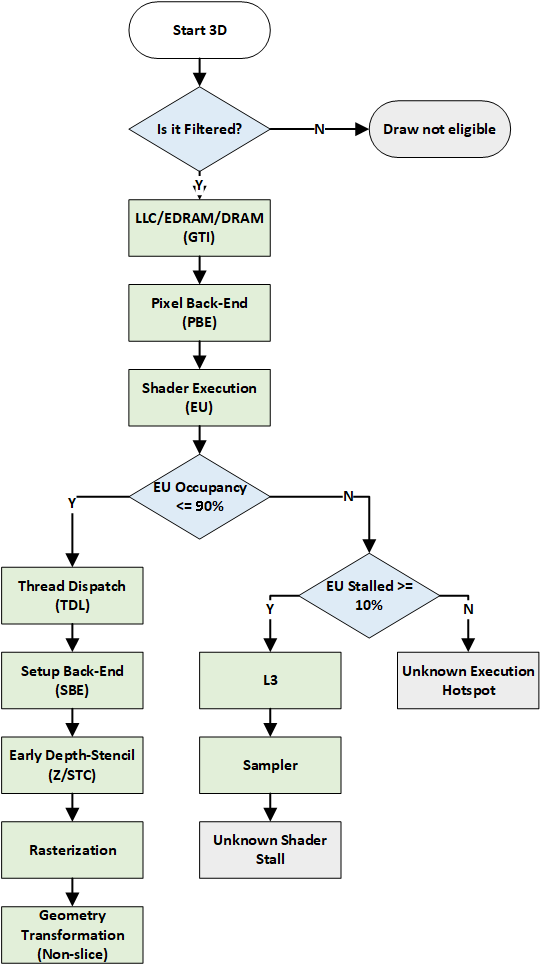
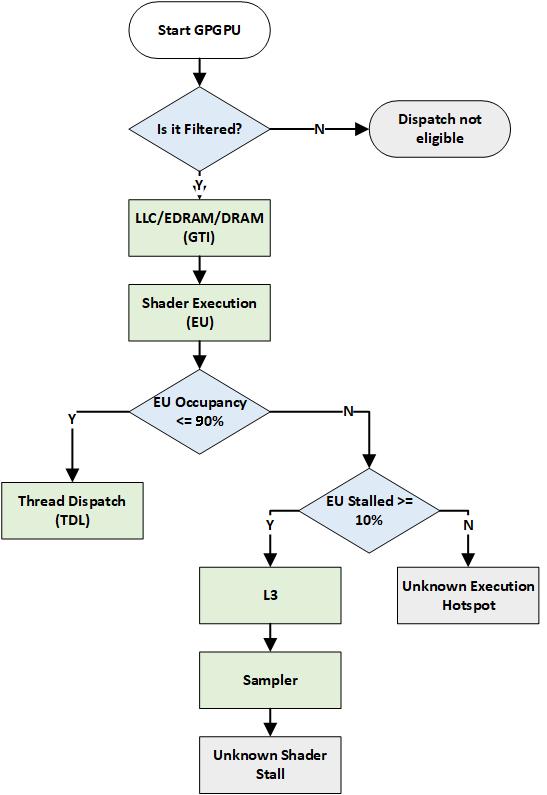
To find the primary hotspot using the metrics, Intel® GPA walks the pipeline in reverse order. Intel® GPA follows two separate workflows for 3D and general-purpose computing designed on graphics processing units (GPGPU).
Workflow for 3D workloads:

Workflow for compute workloads:

Green nodes within the flowcharts represent potential bottlenecks within the GPU. At each node Intel® GPA asks, whether the bottleneck is primary. If yes, the bottleneck for the particular selection is found. If no, Intel® GPA continues to the next node in the flowchart. Blue nodes branch the decision path and grey nodes represent terminal hotspots.
For more information about sampler and shader execution hotspots, read the following sections: Optimize Sampler, Optimize Shader Execution.