Identify Basic GPU-CPU Bound Scenarios
If rendering in your graphics application is visibly slow, explore GPU and CPU queues available in Graphics Trace Analyzer to determine whether your application is GPU-bound or CPU-bound.
Ingredients
To identify GPU-bound graphics applications, you need the following:
- Tool: Intel® GPAGraphics Trace Analyzer
NOTE:
To download a free copy of the Intel® Graphics Performance Analyzers toolkit, visit the Intel® GPA product page.
- Operating System: Windows*
- GPU: Any
- API: DirectX* 9-12, Vulkan*
How to Start Analysis
To get started with your analysis:
- Launch the Intel® GPAGraphics Monitor on your target system.
- Capture a sample trace. A trace contains performance data connected with your application and system.
- Open the captured trace in the Graphics Trace Analyzer to explore performance events in GPU/CPU queues and VSync events generated by a window display manager.
Analyze GPU and CPU queues
Graphics rendering is a process of submitting commands into a graphics driver. Driver batches submitted commands in command buffers, pushes the buffers into a Driver CPU queue, and schedules the commands for executing on the GPU. The size of a queue indicates whether the GPU is busy or starved. The queue size also shows how many graphics commands are submitted, and how many of them wait for the execution.
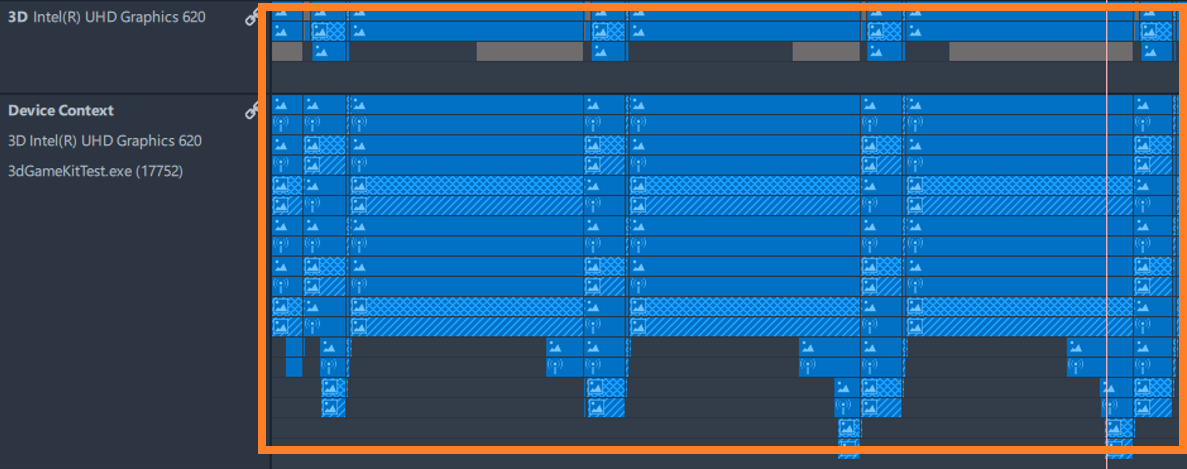
Typical GPU Bound Scenario
- Hardware queue is completely busy executing command buffers and has no visible gaps.
- Driver queue continuously accumulates command buffers waiting for the execution on the GPU.
- Average command buffer execution time exceeds the desired limit based on the expected FPS rate.
NOTE:
Buffer execution time is an interval between command buffer appearance in a queue and executing its last command. The longer this interval, the more GPU-bound your application is.
Typically, a GPU-bound application is an application that has a combination of the following factors: very complicated shaders running on GPU; memory consuming assets, such as geometry or textures; or too many drawing commands submitted into command buffers.
TIP:
For a detailed analysis and optimization of GPU-bound graphics applications, use Graphics Frame Analyzer.
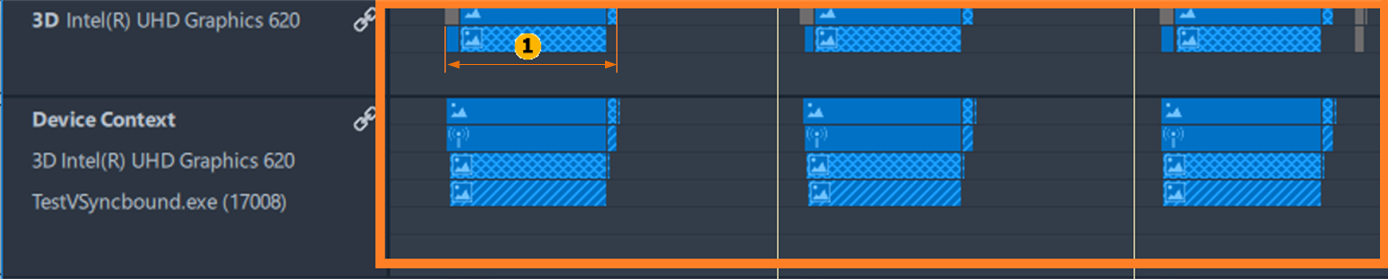
VSync Bound Scenario
- Hardware queue has visible gaps, indicating that the GPU is not fully busy.
- Driver queue has visible gaps, indicating that the CPU part of graphics workload is low enough.
- Frame time is shorter than VSync intervals.
NOTE:
 Frame time is an interval from the appearance of the first frame package in a queue till the execution of the last frame package in the queue.
NOTE:
Disable VSync intervals synchronization in rendering, and then recapture trace to continue analysis. Once VSync intervals are disabled, queue packages distribution on the timeline may change. Your application might appear GPU-bound or CPU-bound.
Typical CPU Bound Scenario
- Hardware queue size is small and has visible gaps. This means that the GPU is idle most of the time.
- Driver queue size is big enough.
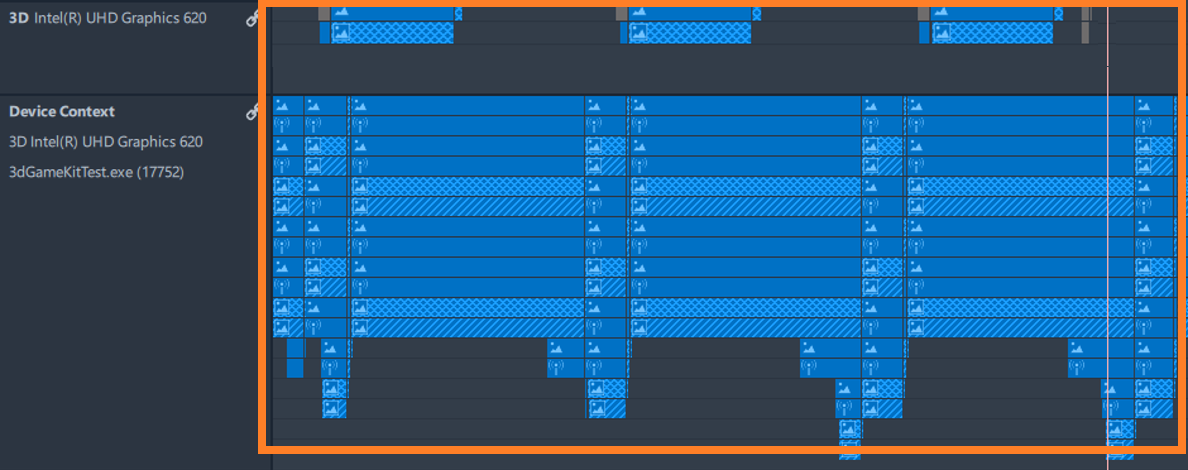
One of the probable scenarios in these conditions can be inadequate synchronization of GPU and CPU parts of rendering, for example, GPU may stall waiting for resources to be prepared on the CPU. Such desynchronization affects User Mode Driver making it accumulate excessive number of packages.
NOTE:
CPU-bound scenario is the most complex case for optimization. Use code analysis provided by Intel® VTune™ Profiler to explore CPU bottlenecks in rendering and frame analysis with Graphics Frame Analyzer to explore GPU bottlenecks. To explore CPU bottlenecks, you can also use Graphics Trace Analyzer tracks with events generated by Debug API and Instrumentation and Tracing Technology API (ITT API) markup.
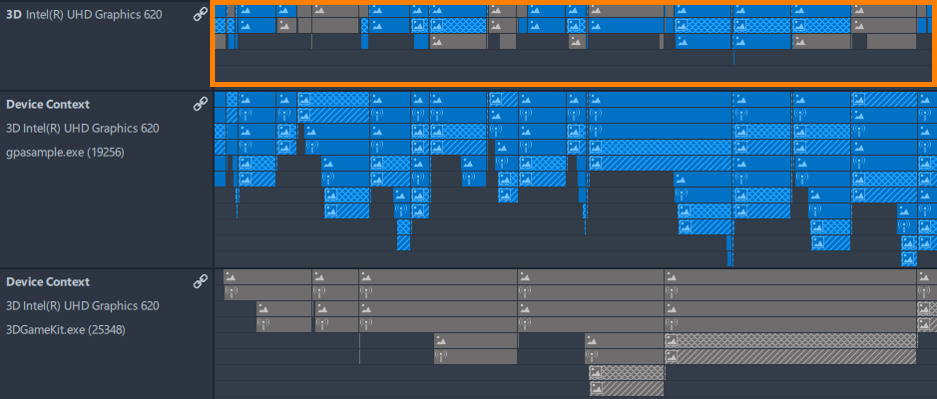
Multi-Process GPU Utilization Scenario
- More than one graphics application run simultaneously.
- GPU queue is full and contains packages from multiple processes.
NOTE:
In the default Graphics Trace Analyzer color scheme, queue packages from different processes have different colors.
NOTE:
In this scenario, it is not possible to define accurately whether the application is GPU-bound or CPU-bound. Stop all irrelevant applications that utilize GPU, and then recapture a trace to continue analysis.
Parent topic: Platform-Based Graphics Performance Analysis