Optimize Shader Execution
Content expert: Igor Surmin
Shader is a program, which handles programmable graphics pipeline stages or performs general-purpose computations on a GPU. Shaders are executed on execution units (EUs) of the GEN architecture. In each EU, the primary computation units are a pair of SIMD (Single Instruction, Multiple Data) floating-point units (FPUs). FPU0 processes floating point and integers operations, FPU1 can perform floating point operations and extended math instructions so it is also referred as Extended Math (EM) unit.
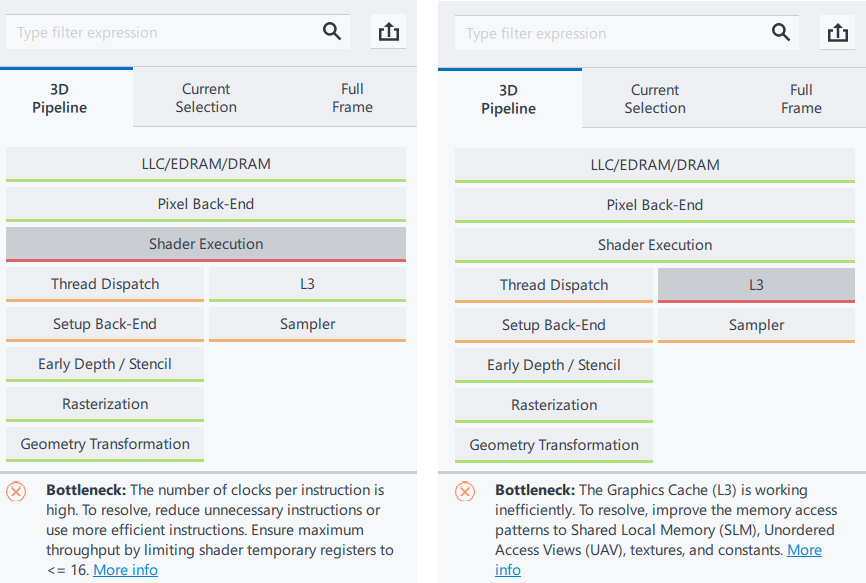
To detect that Shader Execution is a bottleneck, the Intel® GPAGraphics Frame Analyzer checks if an FPU pipes load is more than 90 percent. Usually, the Shader Execution bottleneck is caused by Pixel and Compute shaders that perform complex computations and are executed many times.
| Metric Name | Description |
|---|---|
| EU Array / Pipes: EU FPU0 Pipe Active | Percentage of time the Floating Point Unit (FPU) pipe is actively executing instructions. |
| EU Array / Pipes: EU FPU1 Pipe Active | Percentage of time the Extended Math (EM) pipe is active executing instructions. |
When EU Array / Pipes: EU FPU0 Pipe Active or EU Array / Pipes: EU FPU1 Pipe Active are above 90 percent, it can indicate that the primary hotspot is due to the number of instructions per clock (IPC). If so, adjust shader algorithms to reduce unnecessary instructions or implement using more efficient instructions to improve IPC. For IPC-limited pixel shaders, ensure maximum throughput by limiting shader temporary registers to ≤ 16.
Ingredients
To optimize the Shader Execution bottleneck, you need the following:
- Application: Microsoft D3D12Multithreading sample: https://github.com/microsoft/DirectX-Graphics-Samples/tree/master/Samples/Desktop/D3D12Multithreading
- Tool: Intel® GPAGraphics Frame Analyzer
NOTE:
To download a free copy of the Intel® Graphics Performance Analyzers toolkit, visit the Intel® GPA product page.
- Operating System: Windows* 10
- GPU: Intel® Processor Graphics Gen9 and higher
- API: DirectX* 11/12
Define Code Portions to Optimize
To find potential hotspots in the shader, do the following:
- Open the event with the discovered Shader Execution bottleneck in the Graphics Frame Analyzer Resource Viewer by selecting this event on the Main bar chart.
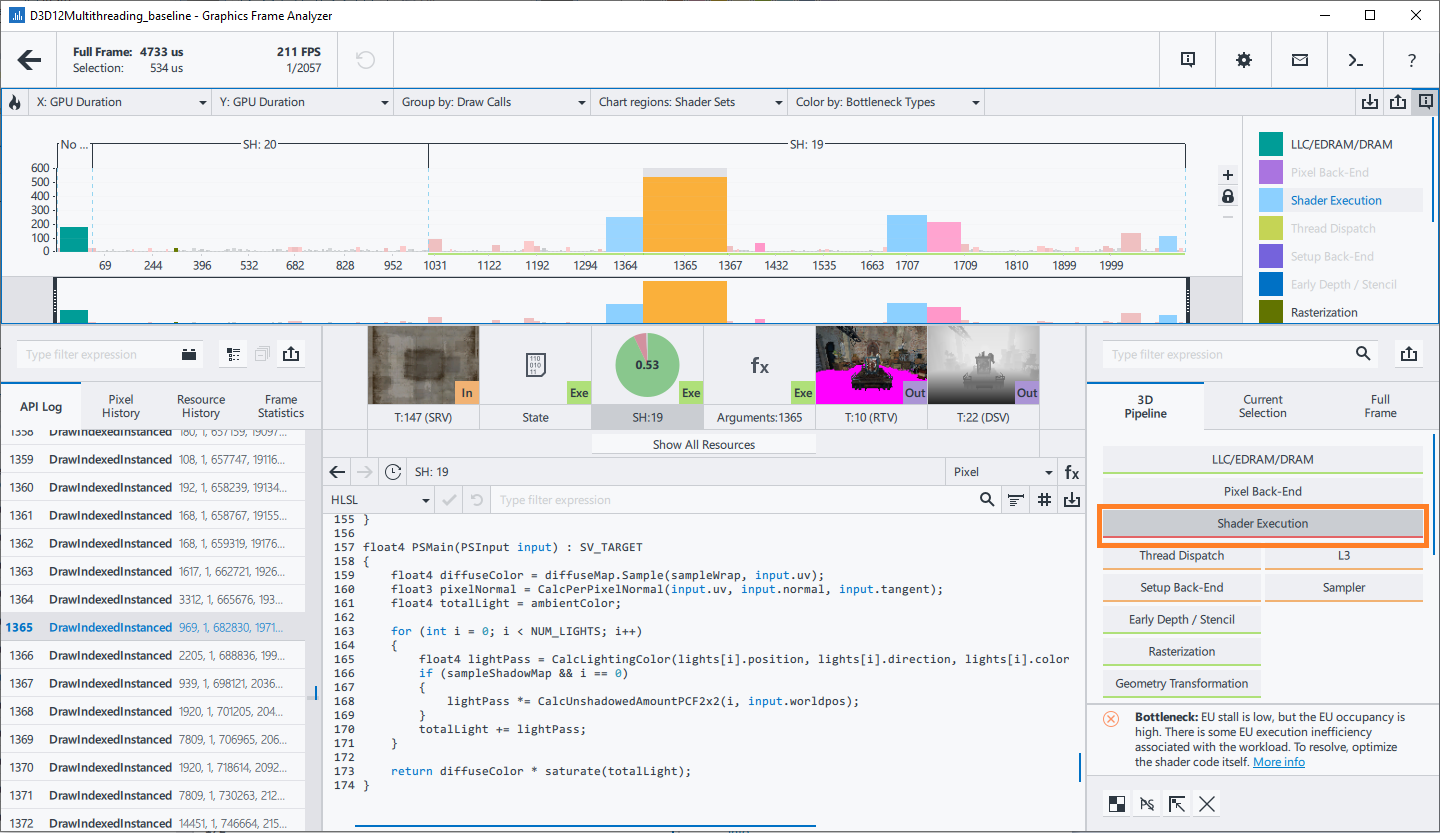
- Select Shader in the Resource List to open the shader source.
- Analyze the shader source to understand the algorithm and find potential places for optimization.
Pixel shader invokes CalcLightingColor for each light (NUM_LIGHTS=3), the first light also computes shadow by the CalcUnshadowedAmountPCF2x2 function. CalcLightingColor function is called three times, other functions are called only once per shader invocation. So CalcLightingColor is potentially the primary place for optimization.
float4 CalcLightingColor(float3 vLightPos, float3 vLightDir, float4 vLightColor, float4 vFalloffs, float3 vPosWorld, float3 vPerPixelNormal)
{
    float3 vLightToPixelUnNormalized = vPosWorld - vLightPos;
    // Dist falloff = 0 at vFalloffs.x, 1 at vFalloffs.x - vFalloffs.y
    float fDist = length(vLightToPixelUnNormalized);
    float fDistFalloff = saturate((vFalloffs.x - fDist) / vFalloffs.y);
    // Normalize from here on.
    float3 vLightToPixelNormalized = vLightToPixelUnNormalized / fDist;
    // Angle falloff = 0 at vFalloffs.z, 1 at vFalloffs.z - vFalloffs.w
    float fCosAngle = dot(vLightToPixelNormalized, vLightDir / length(vLightDir));
    float fAngleFalloff = saturate((fCosAngle - vFalloffs.z) / vFalloffs.w);
    // Diffuse contribution.
    float fNDotL = saturate(-dot(vLightToPixelNormalized, vPerPixelNormal));
    return vLightColor * fNDotL * fDistFalloff * fAngleFalloff;
}
float4 CalcUnshadowedAmountPCF2x2(int lightIndex, float4 vPosWorld) { // Compute pixel position in light space. float4 vLightSpacePos = vPosWorld; vLightSpacePos = mul(vLightSpacePos, lights[lightIndex].view); vLightSpacePos = mul(vLightSpacePos, lights[lightIndex].projection); vLightSpacePos.xyz /= vLightSpacePos.w; // Translate from homogeneous coords to texture coords. float2 vShadowTexCoord = 0.5f * vLightSpacePos.xy + 0.5f; vShadowTexCoord.y = 1.0f - vShadowTexCoord.y; // Depth bias to avoid pixel self-shadowing. float vLightSpaceDepth = vLightSpacePos.z - SHADOW_DEPTH_BIAS; // Find sub-pixel weights. float2 vShadowMapDims = float2(1280.0f, 720.0f); // need to keep in sync with .cpp file float4 vSubPixelCoords = float4(1.0f, 1.0f, 1.0f, 1.0f); vSubPixelCoords.xy = frac(vShadowMapDims * vShadowTexCoord); vSubPixelCoords.zw = 1.0f - vSubPixelCoords.xy; float4 vBilinearWeights = vSubPixelCoords.zxzx * vSubPixelCoords.wwyy; // 2x2 percentage closer filtering. float2 vTexelUnits = 1.0f / vShadowMapDims; float4 vShadowDepths; vShadowDepths.x = shadowMap.Sample(sampleClamp, vShadowTexCoord); vShadowDepths.y = shadowMap.Sample(sampleClamp, vShadowTexCoord + float2(vTexelUnits.x, 0.0f)); vShadowDepths.z = shadowMap.Sample(sampleClamp, vShadowTexCoord + float2(0.0f, vTexelUnits.y)); vShadowDepths.w = shadowMap.Sample(sampleClamp, vShadowTexCoord + vTexelUnits); // What weighted fraction of the 4 samples are nearer to the light than this pixel? float4 vShadowTests = (vShadowDepths >= vLightSpaceDepth) ? 1.0f : 0.0f; return dot(vBilinearWeights, vShadowTests); }float4 PSMain(PSInput input) : SV_TARGET { float4 diffuseColor = diffuseMap.Sample(sampleWrap, input.uv); float3 pixelNormal = CalcPerPixelNormal(input.uv, input.normal, input.tangent); float4 totalLight = ambientColor; for (int i = 0; i < NUM_LIGHTS; i++) { float4 lightPass = CalcLightingColor(lights[i].position, lights[i].direction, lights[i].color, lights[i].falloff, input.worldpos.xyz, pixelNormal); if (sampleShadowMap && i == 0) { lightPass *= CalcUnshadowedAmountPCF2x2(i, input.worldpos); } totalLight += lightPass; } return diffuseColor * saturate(totalLight); } - Select the ISA type in the Shader Code drop-down list to analyze the GEN Assembly.
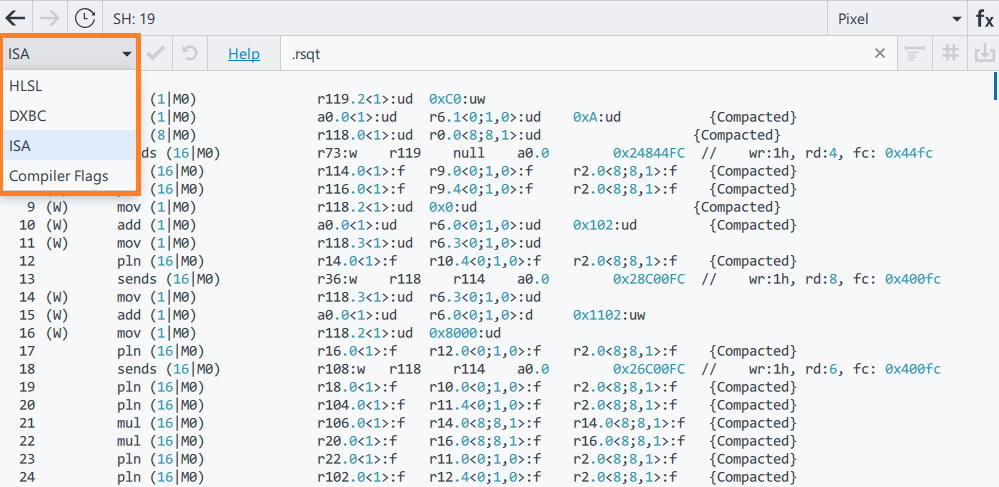
In the GEN Assembly, you can find the instructions, which are generated by Intel® Graphics Compiler. The example also contains a lot of complex math operations, such as square roots, inverse square roots and inversions:
- math.sqt – 3 instructions
- math.rsqt – 9 instructions
- math.inv -– 7 instructions
There is also a lot of arithmetic operations: 83 multiplications and 80 fused multiply/add instructions. To optimize the Shader Execution bottleneck, you can try to reduce unnecessary computations in a shader code or simplify a shader.
Perform Optimization
Once you determined the areas for optimization, try the following corresponding changes to fix the Shader Execution bottleneck:
- Eliminate the constant condition to remove the flow control.
Consider the following condition inside the loop:
166 if (sampleShadowMap && i == 0)
167 {
168 lightPass *= CalcUnshadowedAmountPCF2x2(i, input.worldpos);
169 }
sampleShadowMap is a constant from SceneConstantBuffer. To view the constant buffer content, open the Shader Resource list by clicking the
 button.
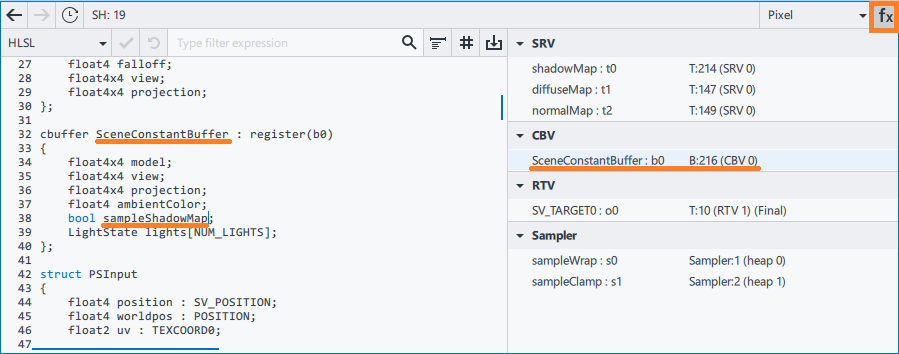
- Click the resource binding description to open the buffer in the Resource Viewer.
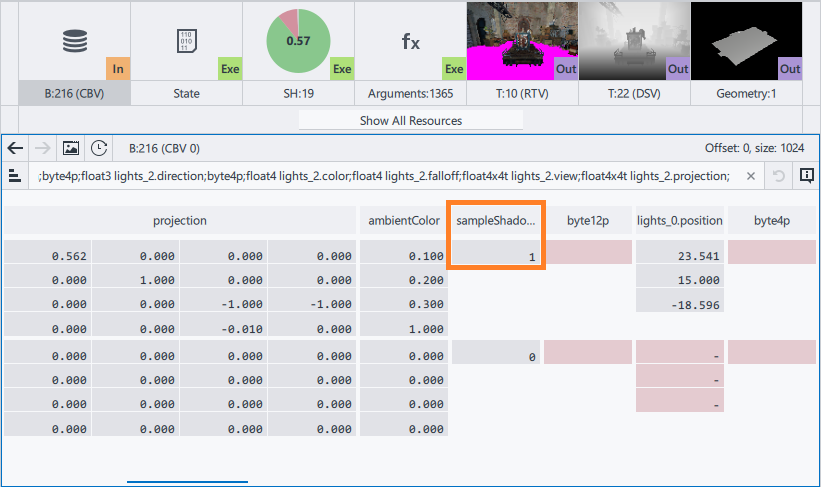

Since sampleShadowMap equals to 1, the condition sampleShadowMap && i == 0 equals to i==0. The modification makes shader linear without flow control instructions, the number of assembly lines reduces from 280 to 263. The only basic block - linear sequence of instructions - contains 262 instructions. It affects the performance insignificantly, but simplifies the further shader analysis.
- Reduce the number of complex math and floating point instructions.
Though there are no explicit square roots in the shader source, these instructions are produced by the normalize() and length() HLSL intrinsics:
58  vVertNormal = normalize(vVertNormal);
59  vVertTangent = normalize(vVertTangent);
61  float3 vVertBinormal = normalize(cross(vVertTangent, vVertNormal));
87 float fCosAngle = dot(vLightToPixelNormalized,  vLightDir / length(vLightDir));
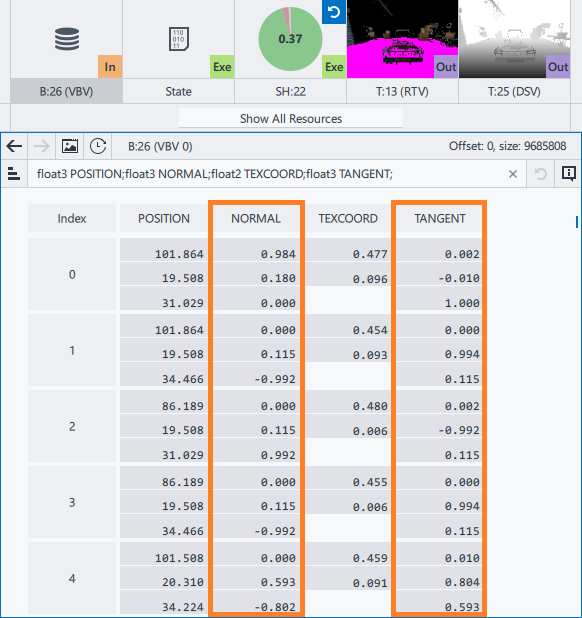
You can find a vertex buffer in the Graphics Frame Analyzer in the same way as the constant buffer content using the Shader Resource panel. If you look at the vertex buffer content, you can see that Normal and Tangent vertex attributes are normalized on the CPU and therefore can be removed from the shader code.
You can also remove divisions by vFalloffs.y and vFalloffs.w:
81  float fDistFalloff = saturate((vFalloffs.x - fDist) / vFalloffs.y);
88 float fAngleFalloff = saturate((fCosAngle  - vFalloffs.z) / vFalloffs.w);
These divisions are redundant, because their divisors are equal to 1. Generally, such divisions can be replaced with multiplication by the inverse parameter.
Light intensity depends on the distance passed from a light position to a pixel. Light attenuation starts from distance 800, the vFalloffs.x parameter. The bounding box size in the sample shader is much smaller than the distance that causes light attenuation.
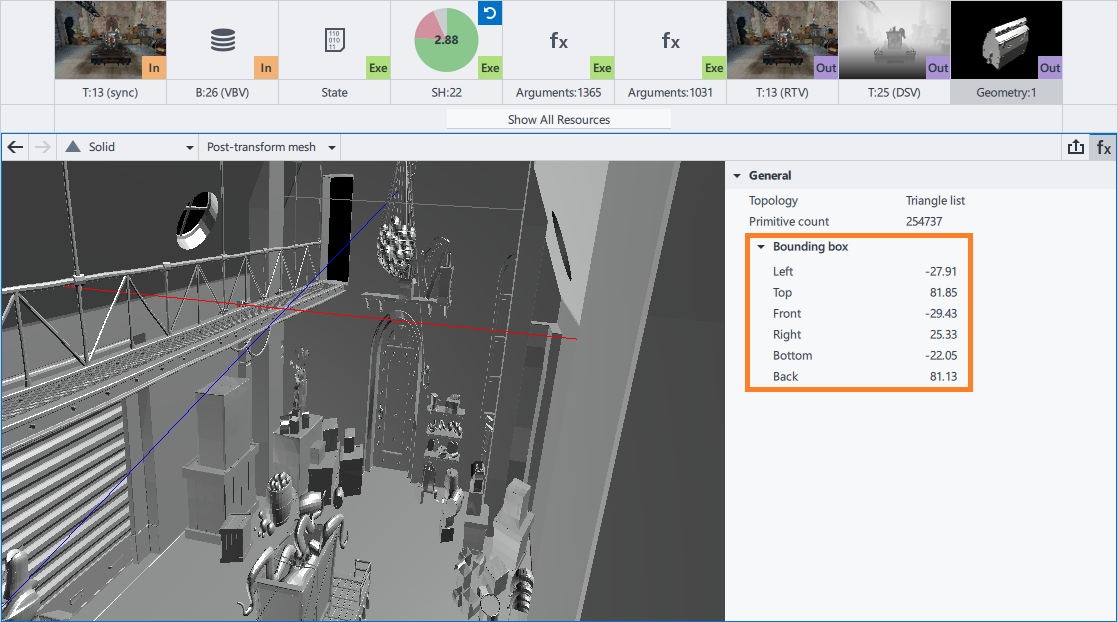
You can remove the distance attenuation without rendering impact, because the saturate(vFalloffs.x - fDist) expression always equals 1. Upon the distance attenuation removal, the shader contains only one inverse instruction and three inverse square root instructions.
Shader performs two subsequent vector-matrix multiplications:
103  vLightSpacePos = mul(vLightSpacePos, lights[lightIndex].view);
104  vLightSpacePos = mul(vLightSpacePos, lights[lightIndex].projection);
Instead of these subsequent multiplications by view and projection matrices, you can precompute the view-projection matrix on the CPU.
As a result, the total number of instructions reduces from 262 to 189.
- Remove redundant function calls.
Lights 0 and lights 2 in SceneConstantBuffer have the same parameters, that is the shader performs the same operations twice.
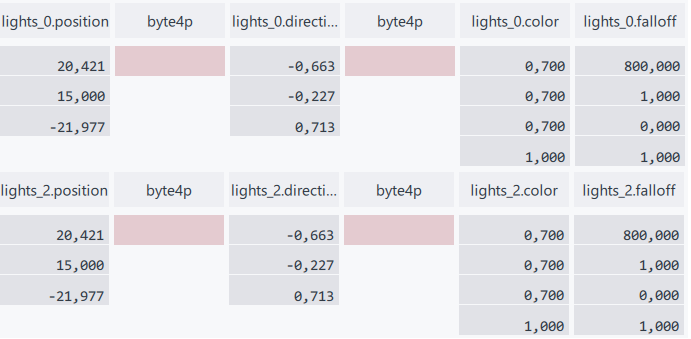
Deleting one extra ComputeLightIntensity function call, reduces the number of instructions from 189 to 166.
The performed optimizations reduce the number of instructions by 1.6 times compared to the original shader.
Verify Optimizations
To check that shader optimizations do not affect rendering, compare the original and modified render targets using the Diff Visualization mode in the Graphics Frame Analyzer:
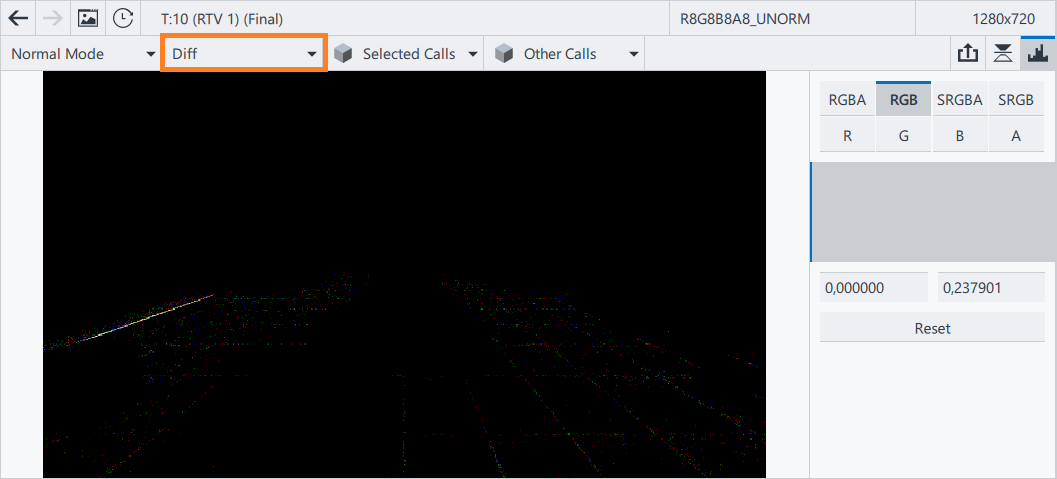
There are no visual changes, a small difference becomes visible on the Color Histogram scaling, as the operations order in the code slightly changed.
The performed optimizations reduce the draw call duration from 549 to 367 us, which gives a 1.5x performance gain. The primary bottleneck in the sample frame moves to the L3 cache:
