Troubleshoot Debugging in Windows*
Target Installation Fails
Error message: Another version of this product is already installed.
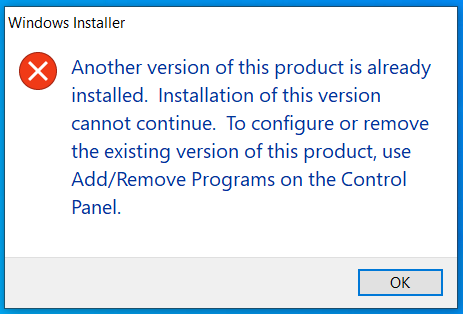
You see this error when Intel® Distribution for GDB* Target from previous releases included in Intel® oneAPI Base Toolkit are installed on your system.
To avoid this error, remove previously installed packages using Add/Remove Programs on the Control Panel.
Unable to start debugging
Error message:
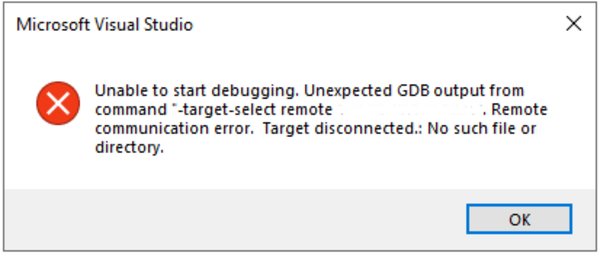
Check whether in Tools > Options > Intel oneAPI > Intel® Distribution for GDB* **, the **Server field is set correctly.
Error message:
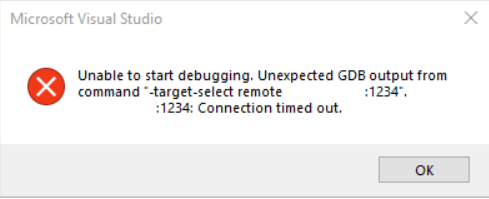
Please ensure that the latest GPU drivers are installed on the target machine. If you are debugging the GPU locally, ensure that the latest GPU drivers are installed on the host machine.
Also, ensure that the device you are trying to offload the kernel to, is present in the list of supported devices.
Deployment errors
Error message:
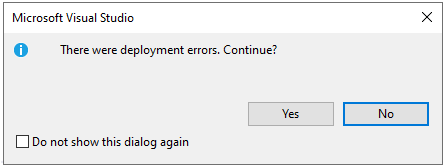
Check if the “Remote Debugger” is running on the target.
If the “Remote Debugger” is running and the error persists, please restart the target and try again.
WMI operation failed
If the following error message appears:
Or a pop-up “Windows* Management Instrumentation (WMI) operation failed” window is shown, disable the Remote User Account Control (UAC) by executing the following command in the console as Administrator:
Try to connect again.
Breakpoint Is Not Hit
No error messages are displayed but a breakpoint inside the kernel is not hit.
Check whether in Tools > Options > Intel oneAPI > Intel® Distribution for GDB*, the Enable Debugging field is set to True.
Verify that debugging is enabled for the “Intel Distribution for GDB with Enhanced GPU Offload.” Refer to the setup instruction for more details.
Unhandled Exception in igc64.so
You can get an unhandled exception coming from IGC at the runtime when the Debug information format is set. To resolve this issue, set Property pages > Linker > Pass additional options to device compilers to /Od.