Debug an Application on a GPU
Tutorial: Debugging with Intel® Distribution for GDB*
This section describes a basic scenario of debugging a program with the kernel offloaded to the GPU.
Before you proceed, make sure you have completed all necessary setup steps described in the Get Started Guide.
For a sample application, set a breakpoint inside the kernel to the line marked as breakpoint-here in the array-transform.cpp file.
To run the application, on the Debug toolbar, click
 Remote Windows Debugger button.
Microsoft Visual Studio* starts the instance of Intel® Distribution for GDB* that is responsible for debugging kernels offloaded to GPU.
NOTE:Once you start Intel Distribution for GDB, you may see several pop-ups.You may be prompted to log in to Intel Distribution for GDB on the target system. Be sure that credentials are set for the target system.
Do not click Cancel when you see the “Attaching to the GPU process” message.
The program stops at the breakpoint. The expected output is the following:

Do not expect the output you receive will match exactly the one provided in the picture. The output may vary due to the nature of parallelism and different machine properties.
Now you can investigate local variables, registers, and disassembly by opening the corresponding windows from the Debug tab.
To investigate local variables, go to Debug > Windows > Locals.
You can see the values of element and result variables during the current state of the program execution.

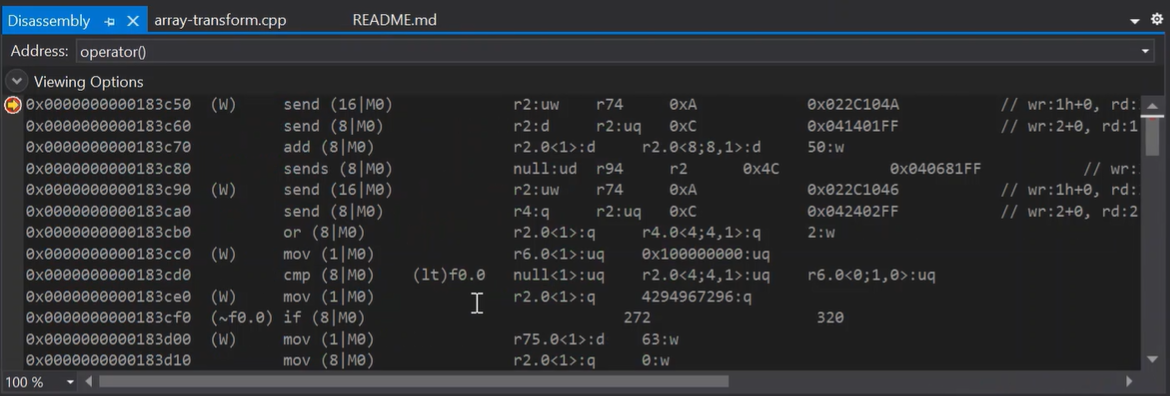
To look into disassembly, go to Debug > Windows > Disassembly.

To investigate registers, go to Debug > Windows > Registers.
You can see general purpose registers.

To see ARF registers in the register window, right-click inside the window and check Other registers option.

You can view the thread ID, location and SIMD lanes additionally with the oneAPI GPU thread view provided by Intel® Distribution for GDB*. This view also provides the selected SIMD lane and device information. To view oneAPI GPU Threads select Debug > Windows > Intel oneAPI GPU Threads.
 NOTE:The information in oneAPI GPU thread window gets populated only when you step inside the kernel code.
To select a different active SIMD lane that does not meet the breakpoint condition and view it’s information, single click on the lane. You can also inspect the local variables for the different lanes. Inactive, lanes cannot be selected.
 NOTE:The last selected lane can be identified by a small box around the SIMD lane.
Selecting the another active thread by double clicking select the first available SIMD lane for the thread. You can then inspect the lane information and local variables.
You can view SIMD lane color scheme by clicking the information button next to SIMD Lanes column in the oneAPI GPU thread window. This opens a popup that signifies the meaning of each color.

You can change the SIMD lane from the toolbar and inspect the change in local variables. To view SIMD Lane in your toolbar, go to View > Toolbars > SIMD Lanes and enable it.

You can step through the program using the
 Step button.
If you click Continue, another thread will hit the same breakpoint, so that you can investigate what is happening inside this thread in detail.
To place SIMD lane specific breakpoint inside a kernel, place an ordinary breakpoint. Once you hit this breakpoint, right click on the breakpoint. This opens a popup where you can select Add SIMD Lane Condition….

Select the thread ID and the SIMD lane where you want the kernel code to break when you continue.

Remove the breakpoints and click Continue to continue until the end of the program.