Using Eclipse IDE to Debug SYCL Applications on a Linux OS Host
This guide describes how to use the Eclipse* Integrated Development Environment (IDE) to debug Data Parallel C++ (SYCL) programs on a Linux* OS host.
In this article, you will learn how to:
Install Eclipse
Configure Eclipse to debug a DPC++ sample program
Install Eclipse
To get started, you need a recent version of the “Eclipse IDE for C/C++ Developers” tool.
Download the latest Eclipse Installer.
Extract the compressed tar file you downloaded.
Start the installer executable and select “Eclipse IDE for C/C++ Developers” from the list of options.
Alternately, you can download a prebuilt “Eclipse IDE for C/C++ Developers” package. Scroll down the downloads page to find the “Eclipse IDE for C/C++ Developers” package.
Configure Eclipse to debug a SYCL sample program
If you have not yet installed the Intel® oneAPI Base Toolkit (Base Kit), follow these steps:
Go to the Intel oneAPI Toolkits website.
Download and install the Base Kit.
During installation, you are asked if you want to set up your IDE. Click “Select Eclipse IDE Configuration” and browse to select the Eclipse installation path.
If the Base Kit is already installed, you can install Eclipse as described in step 1, below.
We are using the array-transform application as an example.
To configure the Eclipse debugger:
You will need to setup the Base Kit environment before launching Eclipse and in order to compile the sample application.
See this guide on how to setup a oneAPI sample project in the Eclipse IDE.
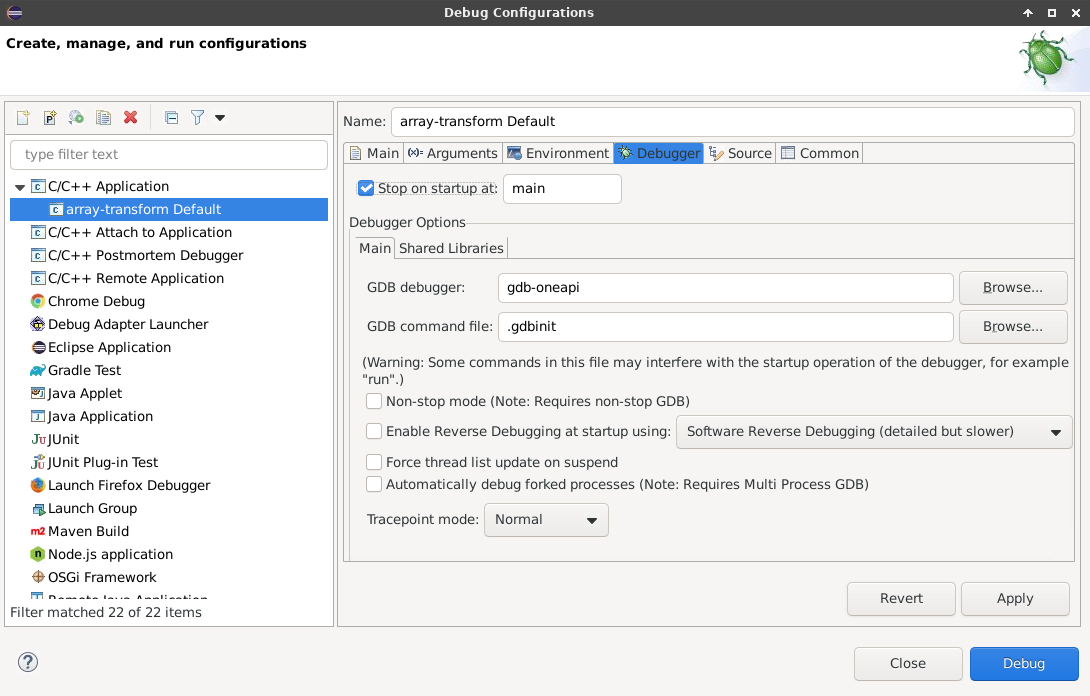
Select Run -> Debug Configurations… to create a Debug Configuration window.
Double-click the C/C++ Application option to create a new Debug Configuration.
Enter array-transform for the C/C++ Application field. This is the name of the application’s compiled binary which we will debug.
In the Debugger tab, set the GDB debugger to gdb-oneapi instead of gdb.

In the Arguments tab, enter either cpu or gpu, depending on which device you want to use for running and debugging this sample application.
NOTE: Real applications usually auto-select the “off-load” target device.
Click Apply and Close.
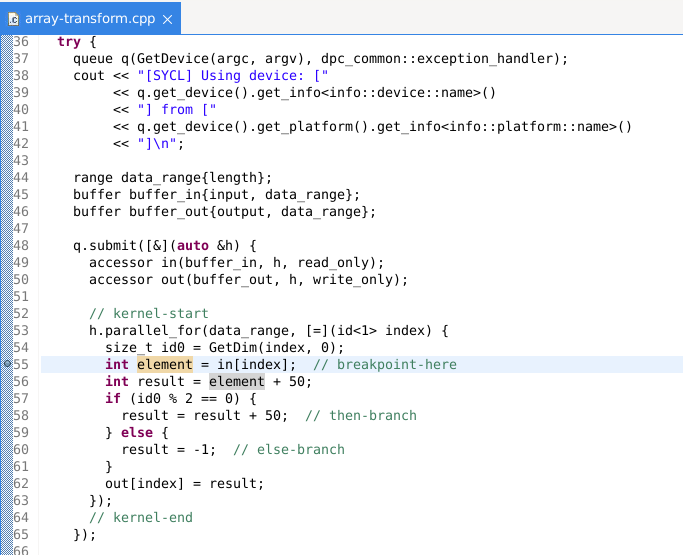
Add two breakpoints in array-transform.cpp one on line 32 and one on line 55 by double-clicking the margin just left of the line number in the source code editor. See the image below.

Then select Run -> Debug.
The application should now be running and you should see it hit the first breakpoint. You can now use the usual GDB* commands:
F5 key to step into
F6 key to step over
F7 key for step return
F8 key for resume
See the Eclipse IDE documentation for more information on how to debug using the “Eclipse IDE for C/C++ Developers.”
Summary
You are now ready to use the Eclipse IDE to debug SYCL applications. Use the references below to learn more about programming with DPC++ and visit the Intel® oneAPI Toolkits site to learn how oneAPI products deliver the tools you need to develop and deploy your applications and solutions across multiple architectures.