Visible to Intel only — GUID: GUID-A0DFBE03-A9D4-4545-A690-BE62A9CD2A8A
Visible to Intel only — GUID: GUID-A0DFBE03-A9D4-4545-A690-BE62A9CD2A8A
Explore Vectorization and Code Insights Results
Intel® Advisor provides several ways to view the Vectorization and Code Insights results.
View Result in CLI
If you run the Vectorization and Code Insights perspective from command line, you can print the results to a terminal or a command prompt and save them to a .txt, .csv, or .xml file.
For example, to generate the Survey report:
advisor --report=survey --project-dir=./advi_results
You should see a similar result:
 ID  Function Call Sites                   Total   Self                  Type                            Why No Vectorization ...
               and Loops                   Time    Time                                                                       ...
_____________________________________________________________________________________________________________________________ ...
14  [loop in main at mmult_serial.cpp:79]  0.495s  0.495s  Vectorized Versions 1 vectorization possible but seems inefficient ...
 6  -[loop in main at mmult_serial.cpp:79] 0.275s  0.275s    Vectorized (Body)                                                ...
 3  -[loop in main at mmult_serial.cpp:79] 0.205s  0.205s    Vectorized (Body)                                                ...
 7  -[loop in main at mmult_serial.cpp:79] 0.015s  0.015s               Peeled                                                ...
11  -[loop in main at mmult_serial.cpp:79]     0s      0s            Remainder   vectorization possible but seems inefficient ...
 4  [loop in main at mmult_serial.cpp:79]  0.510s  0.015s               Scalar   inner loop was already vectorized            ...
12  [loop in main at mmult_serial.cpp:79]  0.510s      0s      Scalar Versions   1 inner loop was already vectorized          ...
 5  -[loop in main at mmult_serial.cpp:79] 0.510s      0s               Scalar   inner loop was already vectorized            ...
The result is also saved into a text file advisor-survey.txt located at ./advi_results/eNNN/hsNNN.
You can generate a report for any analysis you run. The generic report command looks as follows:
advisor --report=<analysis-type> --project-dir=<project-dir> --format=<format>
where:
<analysis-type> is the analysis you want to generate the results for. For example, survey for the Survey report, top-down for the Survey report in a top-down view, map for the Memory Access Patterns, or dependencies for the Dependencies report.
--format=<format> is a file format to save the results to. <format> is text (default), csv, xml.
You can also generate a report with the data from all analyses run and save it to a CSV file with the --report=joined action as follows:
advisor --report=joined --report-output=<path-to-csv>
where --report-output=<path-to-csv> is a path and a name for a .csv file to save the report to. For example, /home/report.csv. This option is required to generate a joined report.
See advisor Command Line Interface Reference for more options.
View Result in GUI
If you run the Vectorization and Code Insights perspective from command line, a project is created automatically in the directory specified with --project-dir. All the collected results and analysis configurations are stored in the .advixeproj project, that you can view in the Intel Advisor.
To open the project in GUI, you can run the following command:
advisor-gui <project-dir>
If you run the Vectorization and Code Insights perspective from GUI, the result is opened automatically after the collection finishes.
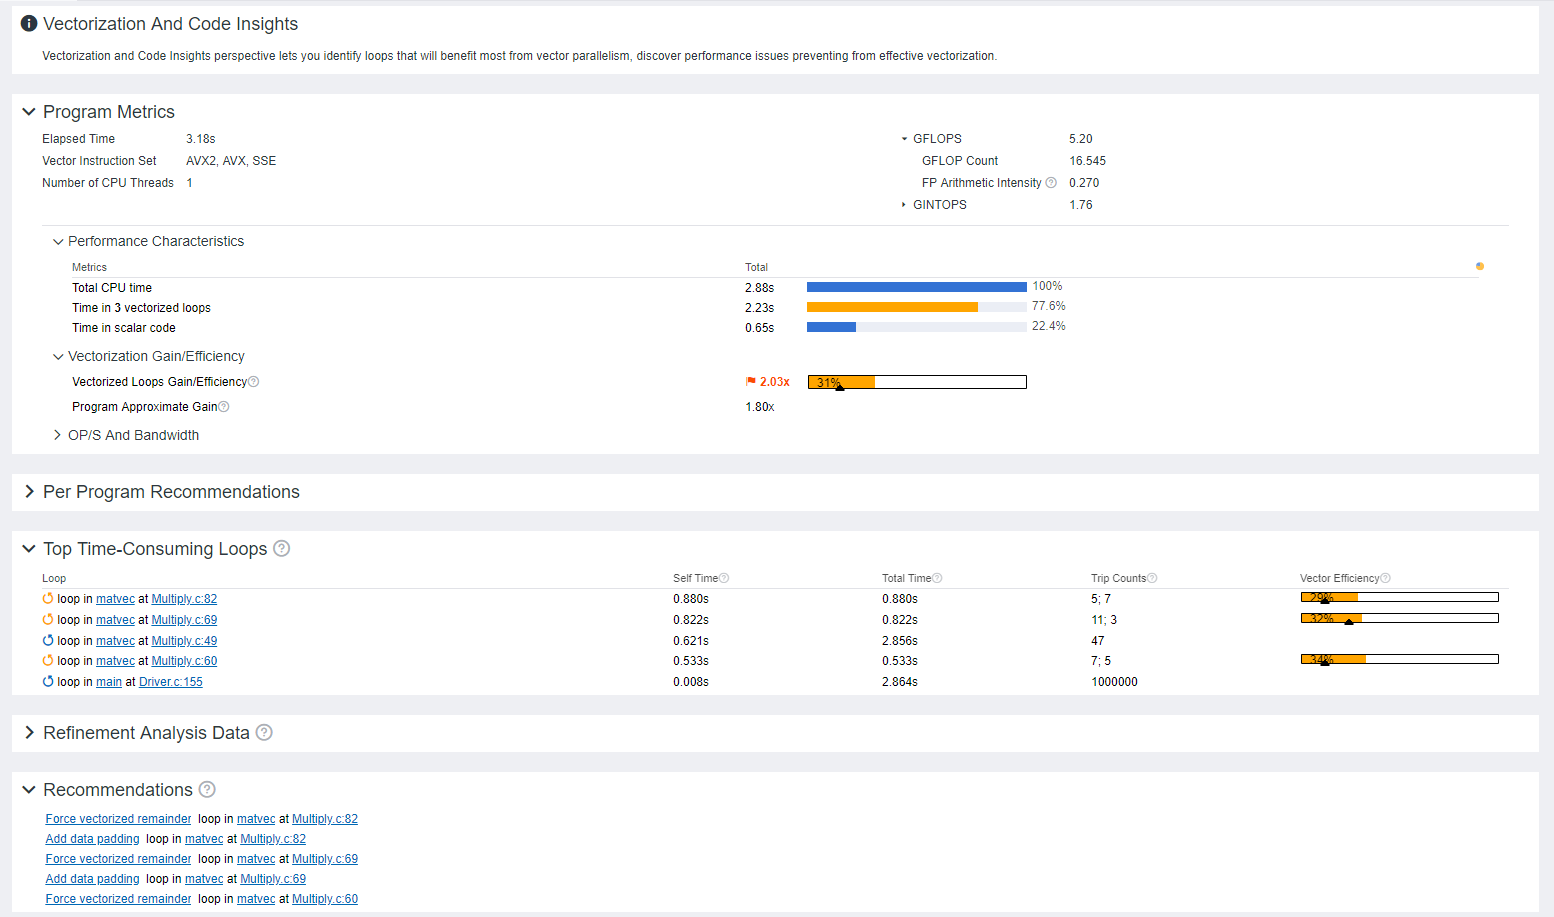
You first see a Vectorization Summary report that includes the overall information about vectorized and not vectorized loops/functions in your code and the vectorization efficiency, including:
Performance metrics of your program and the speedup for the vectorized loops/functions
Top five time-consuming loops and top five optimization recommendations with the highest confidence

Save a Read-only Snapshot
A snapshot is a read-only copy of a project result, which you can view at any time using the Intel Advisor GUI. You can save a snapshot for a project using Intel Advisor GUI or CLI.
To save an active project result as a read-only snapshot from GUI: Click the  button in the top ribbon of the report. In the Create a Result Snapshot dialog box, enter the snapshot details and save it.
To save an active project result as a read-only snapshot from CLI:
advisor --snapshot --project-dir=<project-dir> [--cache-sources] [--cache-binaries] -- <snapshot-path>
where:
- --cache-sources is an option to add application source code to the snapshot.
- --cache-binaries is an option to add application binaries to the snapshot.
- <snapshot-path is a path and a name for the snapshot. For example, if you specify /tmp/new_snapshot, a snapshot is saved in a tmp directory as new_snapshot.advixeexpz. You can skip this and save the snapshot to a current directory as snapshotXXX.advixeexpz.
To open the result snapshot in the Intel Advisor GUI, you can run the following command:
advisor-gui <snapshot-path>
You can visually compare the saved snapshot against the current active result or other snapshot results.
See Create a Read-only Result Snapshot for details.
Result Interpretation
When you run the Vectorization and Code Insights perspective, depending on a configuration chosen, the report can show different levels of details:
- Examine Not-Vectorized and Under-Vectorized Loops
- Analyze Loop Call Count
- Investigate Memory Usage and Traffic
- Find Data Dependencies
For a general overview of the report, see Vectorization Report Overview.
- Vectorization Report Overview
Review the controls available in the main report of the Vectorization and Code Insights perspective of the Intel® Advisor. - Examine Not-Vectorized and Under-Vectorized Loops
- Analyze Loop Call Count
- Investigate Memory Usage and Traffic
- Find Data Dependencies