Identify Performance Bottlenecks Using CPU Roofline
CPU / Memory Roofline Insights perspective enables you to visualize actual performance against hardware-imposed performance ceilings, as well as determine the main limiting factor (memory bandwidth or compute capacity).

There are two ways to run the CPU / Memory Roofline Insights perspective: from the Intel® Advisor GUI and from CLI. Intel Advisor enables you to open results collected using both methods in the GUI.
Run CPU / Memory Roofline Insights Perspective from Intel® Advisor GUI
In the Analysis Workflow pane, the drop-down menu to select the CPU / Memory Roofline Insights perspective, set data collection accuracy level to Low, and click the  button to run it. At this accuracy level, Intel Advisor:
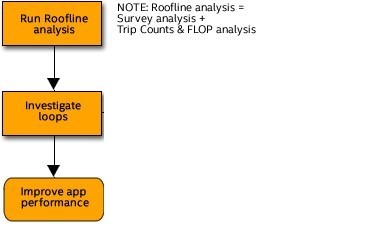
- Measures the hardware limitations of your machine and collects loop/function timings using the Survey analysis.
- Collects floating-point and integer operations data, and memory data using the Characterization analysis.
For details about data collection accuracy presets, see Intel Advisor User Guide: CPU Roofline Accuracy Presets. Upon completion, Intel Advisor displays a Roofline chart.
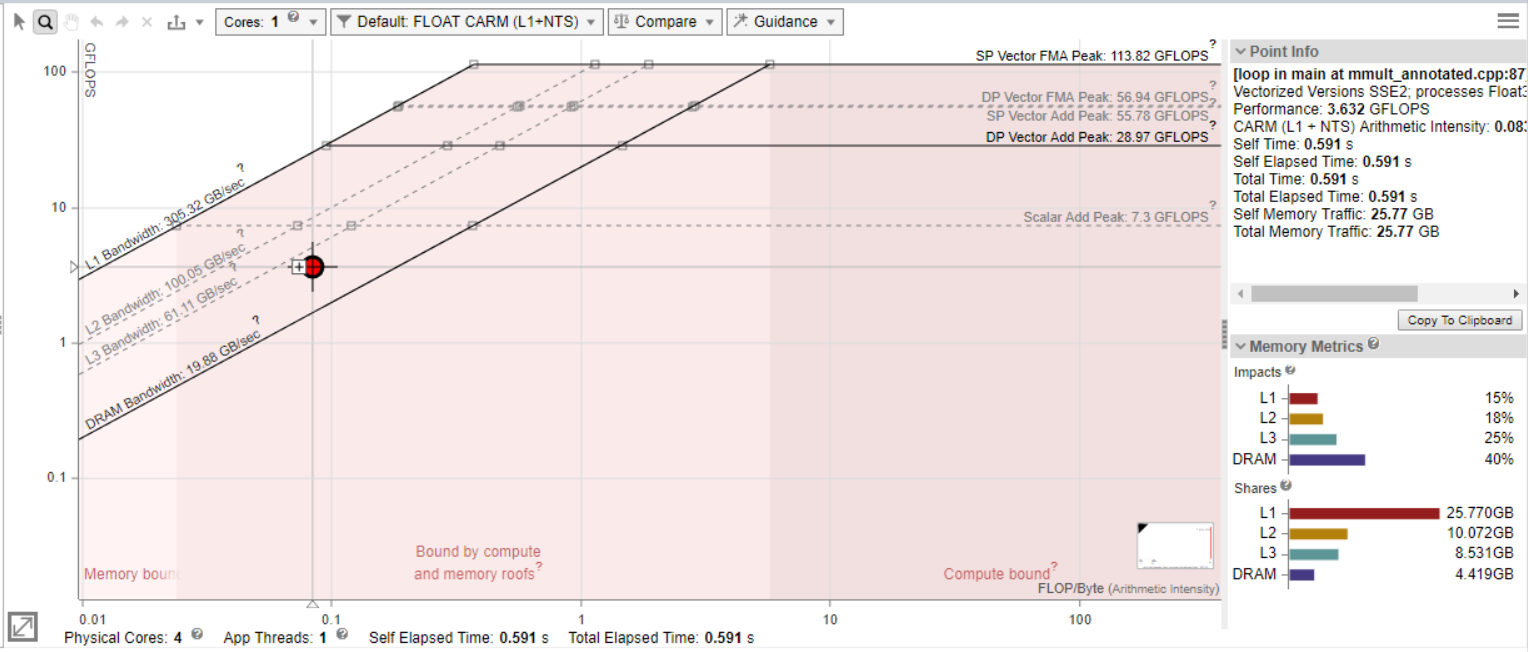
The Roofline chart plots an application's achieved performance and arithmetic intensity against the machine's maximum achievable performance:
- Arithmetic intensity (x axis) - measured in number of floating-point operations (FLOPs) and/or integer operations (INTOPs) per byte, based on the loop/function algorithm, transferred between CPU/VPU and memory.
- Performance (y axis) - measured in billions of floating-point operations per second (GFLOPS) and/or billions of integer operations per second (GINTOPS).
In general:
- Dots of different color and size represent functions/loops. The size and color of a dot represent execution time for this loop/function in relation to total execution time of the application. Large red dots are profitable to optimize as they take the longest execution time. Small green dots take less time and may be poor candidates for optimization.
- Diagonal lines indicate memory bandwidth limitations preventing loops/functions from achieving better performance without optimization. For example, the L1 Bandwidth roofline represents the maximum amount of work that can get done at a given arithmetic intensity if the loop always hits L1 cache. A loop does not benefit from L1 cache speed if a dataset causes it to miss L1 cache too often. In this case, it is subject to the limitations of the lower-speed L2 cache it is hitting. So, a dot representing a loop that misses L1 cache too often but hits L2 cache is positioned below the L2 Bandwidth roofline.
- Horizontal lines indicate compute capacity limitations preventing loops/functions from achieving better performance without optimization. For example, the Scalar Add Peak represents the peak number of add instructions that can be performed by a scalar loop under these circumstances. The Vector Add Peak represents the peak number of add instructions that can be performed under these circumstances by a vectorized loop with the highest instruction set available. So, a dot representing a loop that is not vectorized is positioned somewhere below the Scalar Add Peak roofline.
- A dot cannot exceed the topmost rooflines, as these represent the maximum capabilities of the machine; however, not all loops can utilize maximum machine capabilities.
The greater the distance between a dot and the highest achievable roofline, the more room for optimization a function/loop has.

Run CPU / Memory Roofline Insights Perspective from Command Line Interface
To run CPU / Memory Roofline Insights perspective using advisor command line interface, use the following command:
advisor --collect=roofline --project-dir=./advi --search-dir src:p=./advi –- myApplication
This command is a batch mode that runs two analyses one by one:
- Survey analysis that collects loops/functions execution time data.
- Characterization analysis that collects floating-point and integer operations, memory traffic and mask utilization metrics for AVX-512 platforms to measure arithmetic intensity and performance of your application, and compute capacity of your hardware.
To view the achieved performance of your application against hardware-imposed performance ceilings on an interactive Roofline chart, open the collected results in the Intel Advisor GUI or use the following command to generate an interactive HTML Roofline report:
advisor --report=roofline --report-output=./advi/advisor-roofline.html --project-dir=./advi
Where report-output option specifies the directory and the HTML file into which Intel Advisor saves the generated report.
For details about generating CLI reports, see the respective section in the Intel Advisor User Guide or use the following command in your terminal:
advisor --help report
Intel Advisor enables you to create a read-only result snapshot using the following command:
advisor --snapshot --project-dir=./advi --pack --cache-sources --cache-binaries -- /tmp/my_proj_snapshot
What's Next
If one or more loops is not vectorizing properly and performance is unsatisfactory:
- Consider working with the most time-consuming function/loop indicated on a Roofline chart.
- Use the Code Analytics tab to examine the main information for the selected function/loop. Refer to the Roofline pane to identify whether the function/loop is compute or memory bound.
- Use Recommendations tab to view hints on possible optimization steps for the selected function/loop in the Roofline Guidance section.
- If your loop is compute bound:
- Check the Vectorized Loops/Efficiency values in the Survey Report.
- Consider running Dependencies analysis to discover why the compiler assumed a dependency and did not vectorize the selected function/loop.
- Consider running Memory Access Patterns (MAP) analysis to identify expensive memory instructions.
- If your loop is memory bound:
See Also
- Explore the common use cases described in Intel Advisor Cookbook:
- Explore useful Roofline Resources for Intel Advisor Users.