Visualize Performance Improvements with Roofline Compare
Use the Roofline Compare feature to identify similar loops or functions in different Roofline analysis results and help make informed optimization choices about your code. This section describes how to compare two Roofline analysis results to visualize improvements made by loops and functions in an application.
Scenario
In this recipe, we’ll use the Roofline Compare feature to show us the improvements obtained in each step of a series of optimizations.
Ingredients
This section lists the hardware and software used to produce the specific results shown in this recipe:
Performance analysis tools: Intel Advisor
The latest version is available for download at: https://www.intel.com/content/www/us/en/developer/tools/oneapi/advisor.html
Application: The Vector Sample code, available as part of the samples package in the Intel Advisor installation folder. The code and optimization process being followed in this recipe is part of the Add Efficient SIMD Parallelism to Code Using the Vectorization Advisor tutorial. Intel Advisor tutorials are available at: https://www.intel.com/content/www/us/en/docs/advisor/user-guide/current/tutorials-and-samples.html
Compiler: Microsoft® C/C++ Optimizing Compiler Version 19.14.26431 for x64
Operating system: Microsoft® Windows 10, Version 1709
CPU: Intel® Core™ i5-7300HQ processor
Collect Baseline Roofline Results
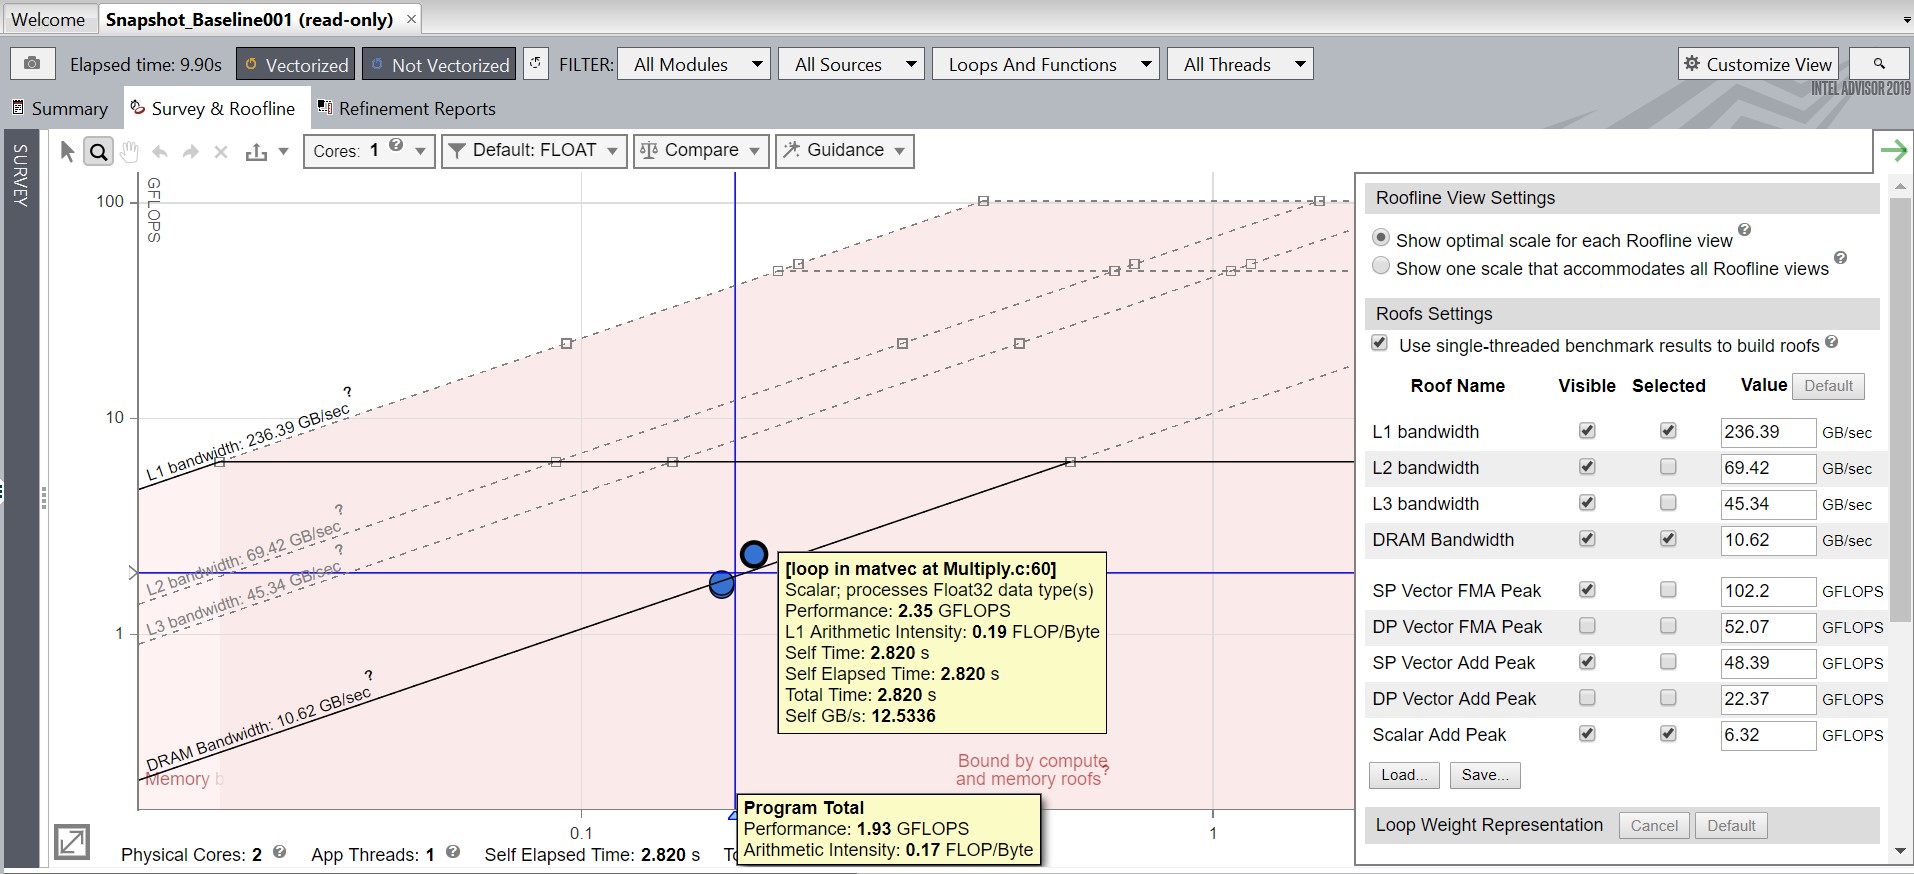
With the default compiler optimization option set to O2, generate a Roofline analysis and save the result using the Snapshot feature  . We’ll call this result Snapshot_Baseline. View the Roofline plot, as shown in the image below. As you hover the mouse over the dots, the performance metrics for the loops display. The crosshairs drawn between the loops, which when hovered over with the mouse highlights as blue horizontal and vertical lines, provide performance metrics for the complete program.
For better visibility of results, we will fix the L1, L2, L3, and DRAM bandwidth to the values shown in the Roofs Settings table, displayed below. Also, as the application is using only single precision floats, we will turn off the double precision peaks by clearing the Visible checkboxes. Save the view as a json file with the name Favourable View using the Save button. We will use the same settings in further Roofline plots by loading Favourable View.
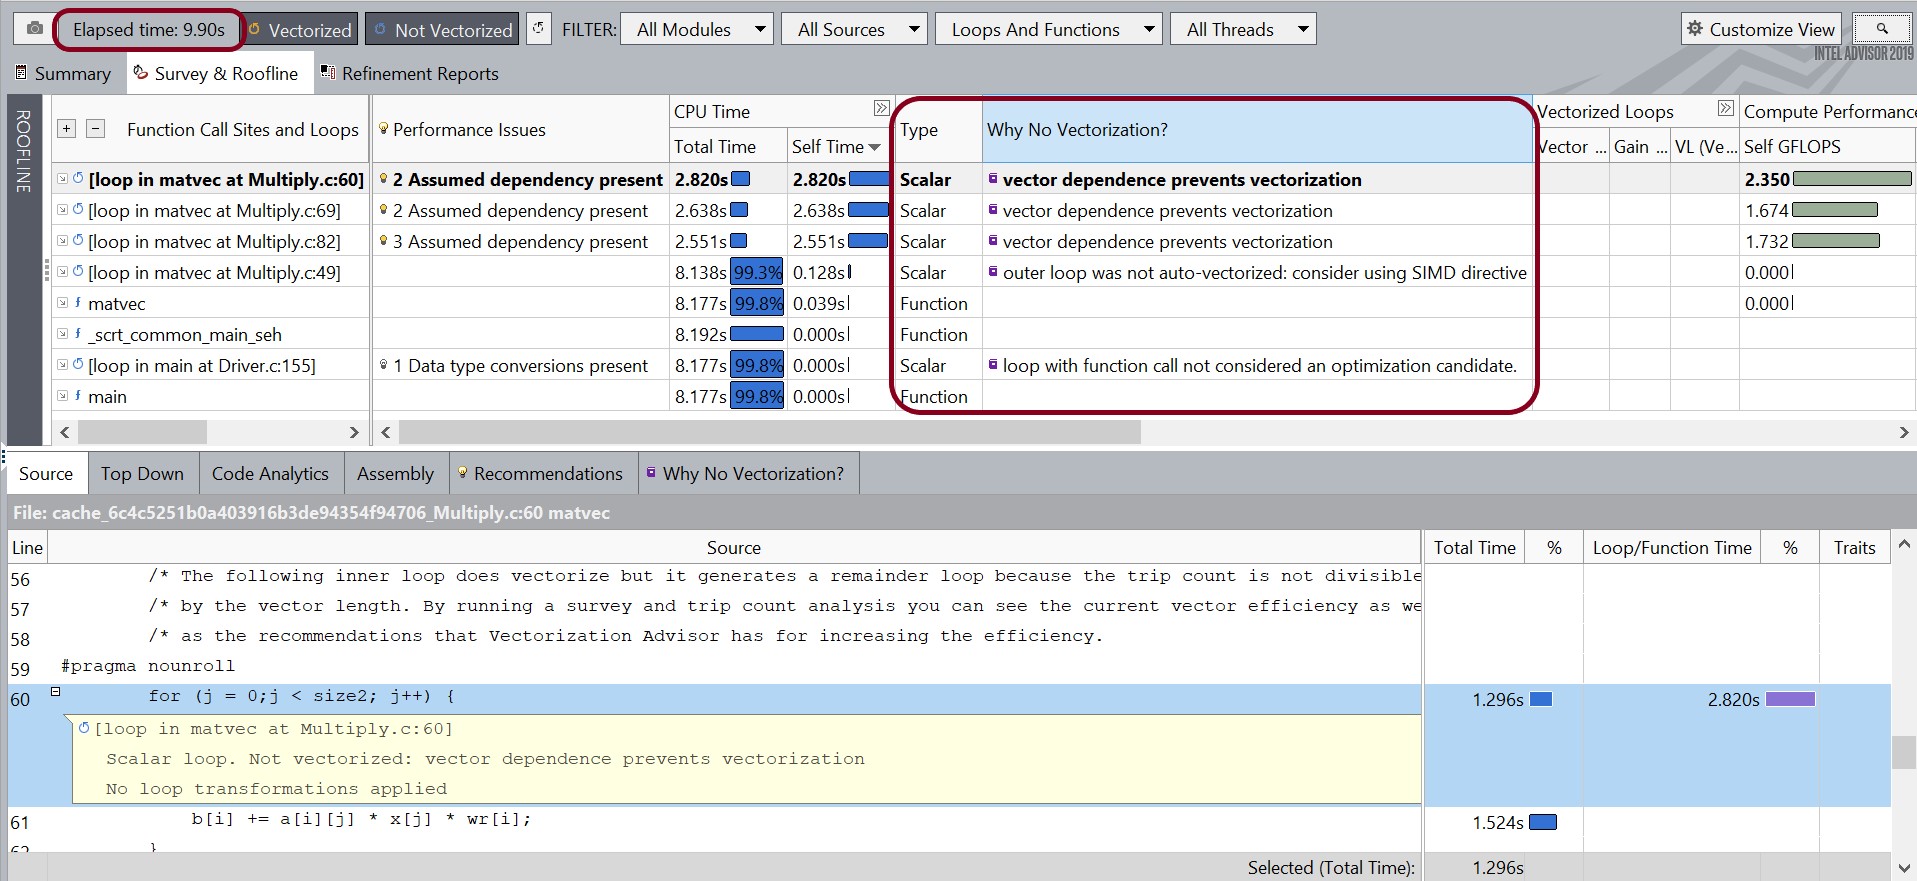
In the Survey report for Snapshot_Baseline, note the following:
The Elapsed time value in the top left corner. This is the baseline against which subsequent improvements will be measured.
In the Type column, all detected loops are scalar.
In the Why No Vectorization? column, the compiler detected or assumed vector dependence in most of the loops.
Optimize with the NOALIAS Macro
Click the Why No Vectorization? tab, then click one of the loops for which the compiler previously detected or assumed vector dependence.
Scroll down to the Recommendations section to view suggestions for vectorizing the loop. In the example below, one of the suggestions is to use the restrict keyword.

restrict ensures that two pointers cannot point to overlapping memory regions. If the compiler knows that there is only one pointer to a memory block, it can produce better vectorized code. In the first optimization, we will try to limit the effect of pointer aliasing by providing some information to the compiler using the NOALIAS macro.
In the Visual Studio* IDE, right-click the vec_samples project in the Solution Explorer, then choose Properties.
Choose Configuration Properties > C/C++ > Command Line. In the Additional Options area, type /DNOALIAS.
Click Apply, then click OK.
Choose Build > Rebuild Solution.
Re-run the Roofline Analysis
In the Vectorization Workflow pane, click the Collect button below Run Roofline and save a snapshot of the result as Snapshot_NoAlias (preferably in a new directory, though this is not strictly required).
- Load the Favourable View json file by clicking the menu icon
 in the top right corner. Once the file is loaded, the roofs are adjusted accordingly to Snapshot_Baseline.
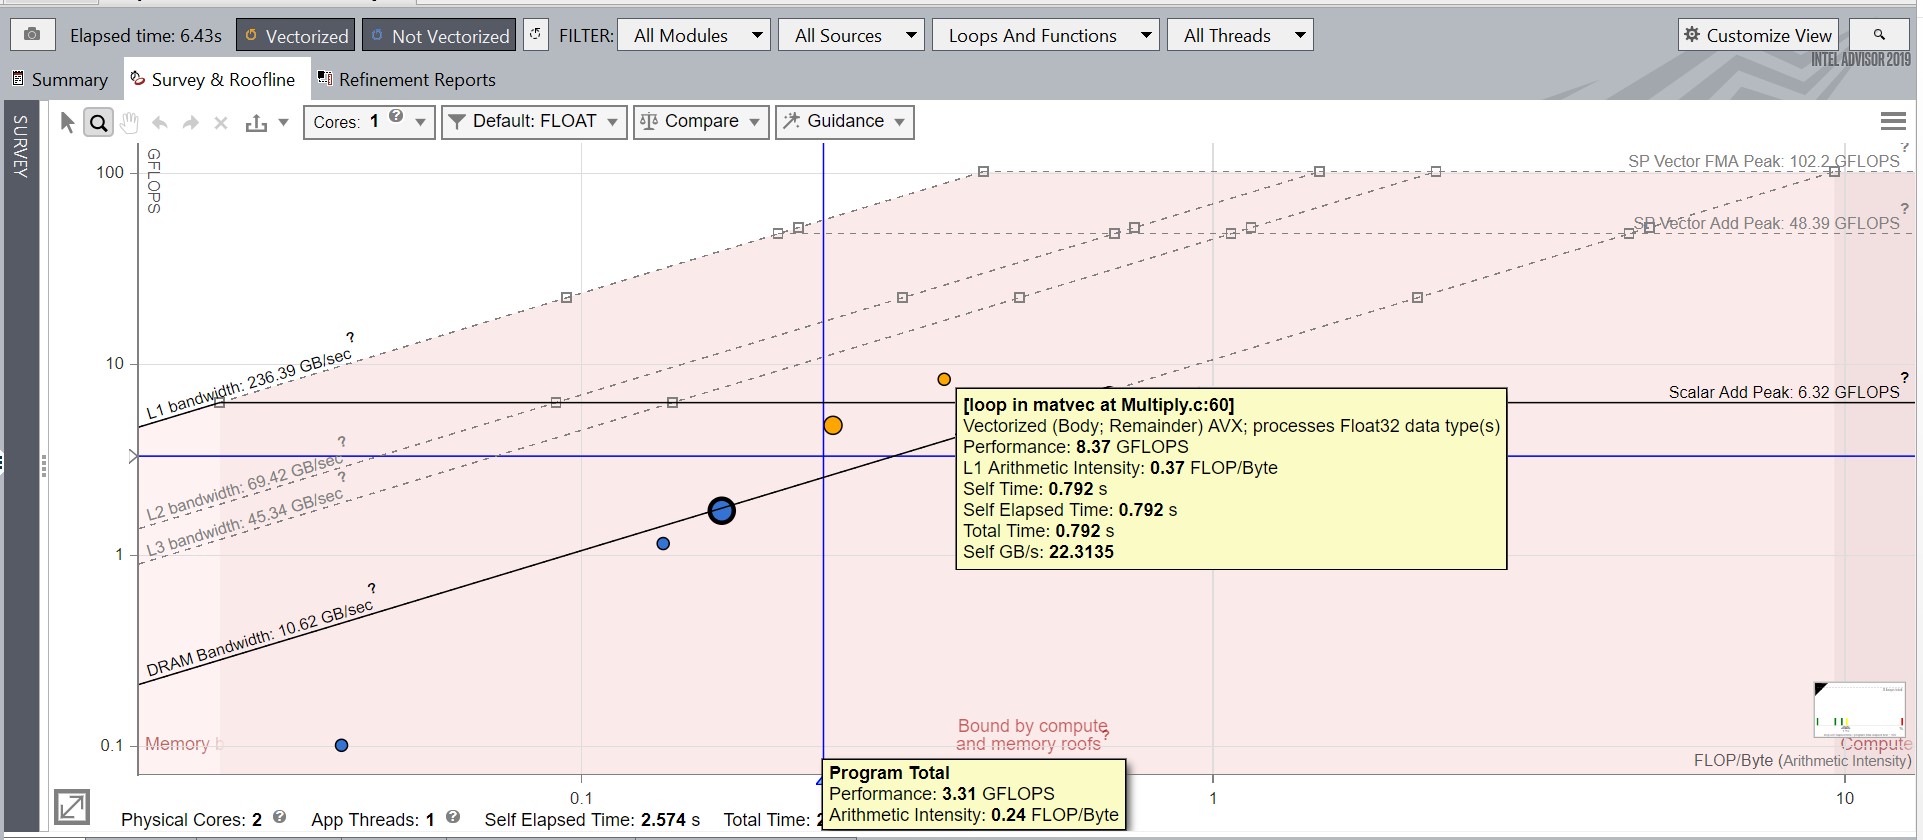
 Notice the improvements in the total performance of the program and loop in matvec at Multiply.c:60, as shown in the image below.
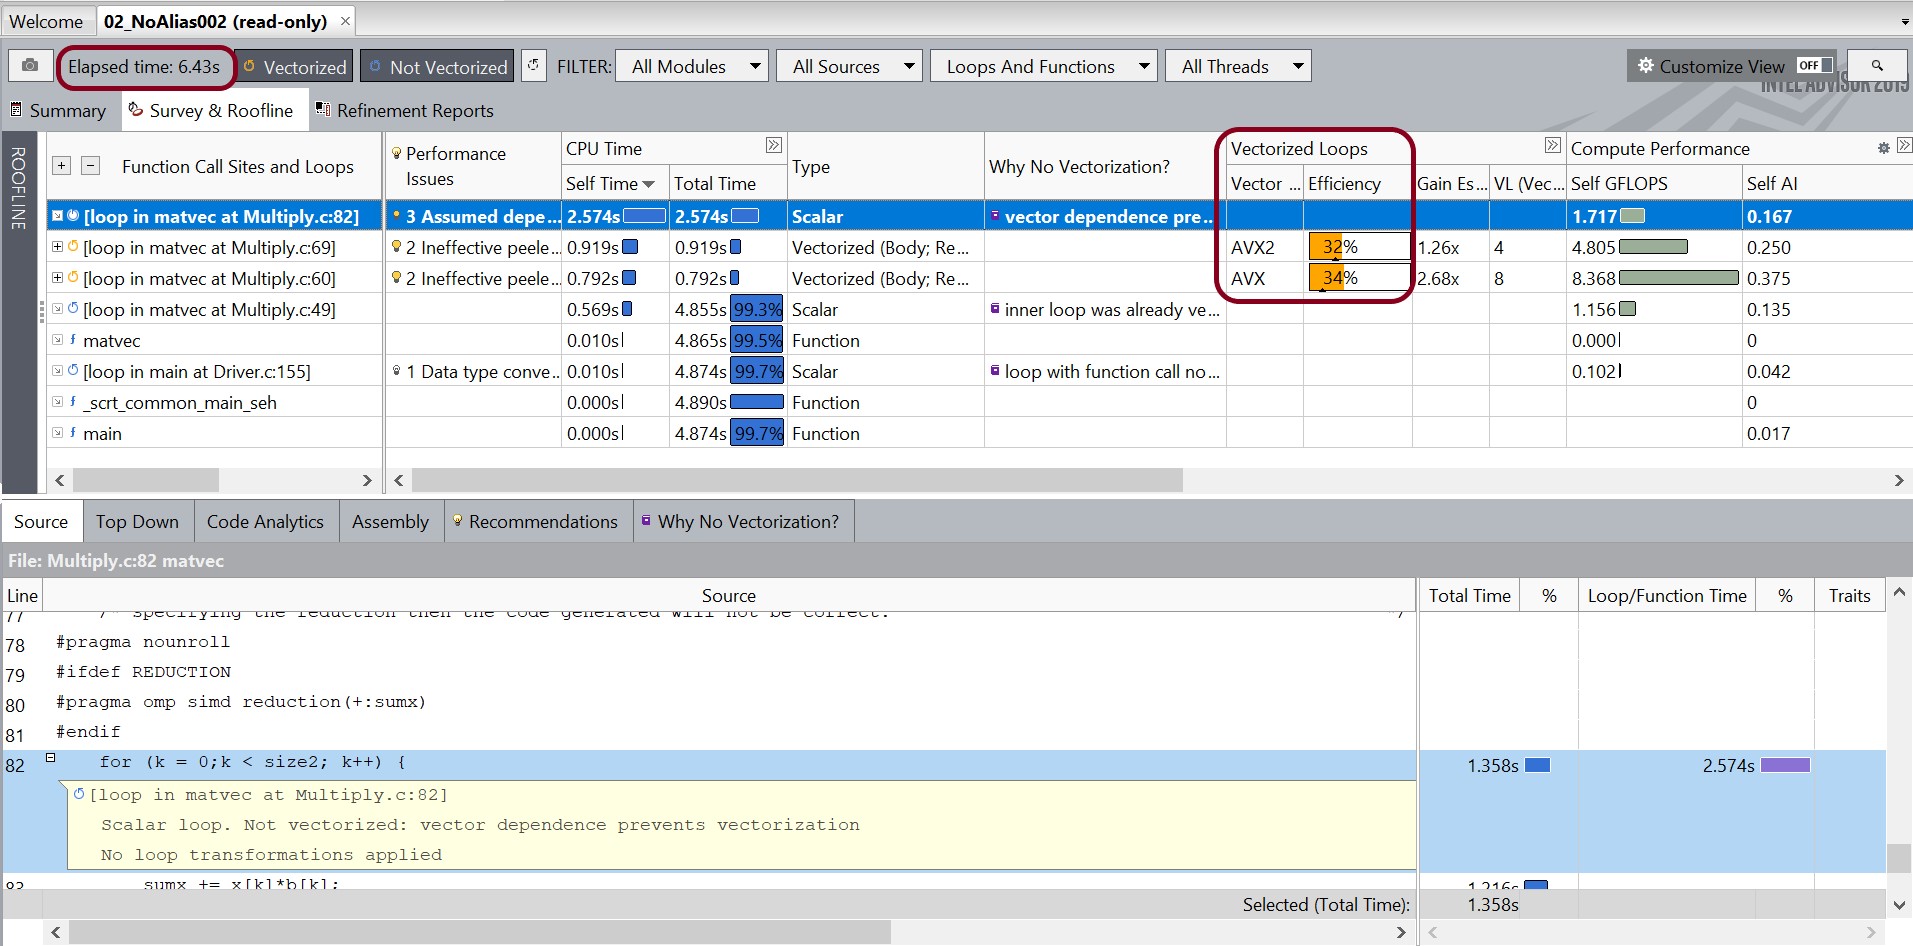
In the Survey report, notice that:
The value in the Vector Instruction Set column is probably AVX2/AVX/SSE2, i.e., the default vector Instruction Set Architecture (ISA).
The compiler successfully vectorizes two loops: in matvec at Multiply.c:69 and in matvec at Multiply.c:60.
Elapsed time improves substantially.
Open the Snapshot_Baseline snapshot.
In Snapshot_Baseline, go to the Roofline plot and click the Compare drop-down list
 , followed by the + Load result for comparison icon. Intel Advisor shows any snapshots in the same directory as Snapshot_Baseline in the Ready for comparison list. These snapshots can be used for Roofline comparisons. Select Snapshot_NoAlias using the Load result for comparison option. NOTE:You can remove a comparison result using the × Clear comparison result(s) icon.
For the rest of this recipe, we’ll compare optimized snapshots against Snapshot_Baseline. The Current result therefore refers to Snapshot_Baseline. A different shape is used to plot the loops and functions in each snapshot. For example, in the image below, circles represent the Current result, while Squares represent the Snapshot_NoAlias results.
For better visibility, we''ll use the Filter In Selection feature. Right-click an interesting loop or function in the Roofline plot and select Filter In Selection. This shows only the position of that loop in the Roofline plot. This feature is very useful when you want to filter for an interesting loop in applications with hundreds of loops and functions. In this case, we'll filter in the loop in matvec at Multiply.c:60. To remove the filtering, right-click anywhere in the Roofline plot and choose Clear Filters.

Notice the loop in matvec at Multiply.c:60 in the Roofline plot has changed its color, as it was scalar in Snapshot_Baseline and vectorized in Snapshot_NoAlias.
The Roofline Compare feature automatically recognizes similar loops from both snapshots. It connects related loops with a dashed line and displays the performance improvement between the loops, i.e., the difference in FLOPS (or INTOPS or OPS) and Total Time.

To find the same loops among the results, Intel Advisor compares several loop features, such as loop type, nesting level, source code file name and line, and name of the function. When a certain threshold of similar or equal features is reached, the two loops are considered a match and connected with a dashed line.
However, this method still has few limitations. Sometimes there can be no match for the same loop if one is optimized or parallelized or moved in the source code to four or more lines from the original code.
Intel Advisor tries to ensure some balance between matching source code changes and false positives.
ΔFLOPS (can be also INTOPS or OPS, depending on the data type) implies the Performance difference between the compared loop and current loop. The figure shows that the compared loop has an improved computational performance by 6.02 units*, as performance has increased from 2.35 to 8.37 units. In percentage terms:
71.92% = 6.02 units / 8.37 units * 100%
8.37 GFLOPS – Performance value for the compared loop
2.35 GFLOPS – Performance value for the current loop
*units can be GFLOPS/GINTOPS/Giga Mixed OPS depending on the data type. In the above result, the units are GFLOPS.
Δt implies the Total Time difference between the compared loop and current loop. In the above example, we can see that the compared loop has a Total Time value reduced by 2.028 s: from 2.820 s to 0.792 s.
Please note that the difference in the example is negative (-2.028), because we always subtract the current loop value from the compared loop value for both Δ (FLOPS, time) metrics. This allows the user to see both performance improvement and performance degradation depending on the selected loop.
In percentage terms, the Total Time difference is:
-71.91% = -2.028 s / 2.820 s * 100%
0.792 s – Total Time value for the compared loop
2.820 s – Total Time value for the current loop
The dashed line displays the value of the performance difference (ΔFLOPS in our case) as a percentage of maximum performance values between two loops.

In the side-by-side view of the Survey report and Roofline comparison plot above, clicking on each loop in the Survey report highlights the corresponding loop in the Roofline plot and also highlights the dashed line connecting similar loops. Note that in the image above, we have removed the Filter In Selection feature to visualize this better.
From the Roofline snapshot and Survey report for Snapshot_NoAlias, we can see that there is still room for improvement for the loops in Snapshot_NoAlias.
Continue to Optimize: Dependencies and More
The QxHost option helps the compiler to generate instructions for the highest instruction set available on the compilation host processor. Rebuilding the solution using the /QxHost command-line option can help us further improve performance depending on the underlying hardware architecture.
The compiler is often conservative when assuming data dependencies and always assumes the worst-case scenario. We can use a refinement report to check for real data dependencies in loops. In earlier results, the compiler did not vectorize the loop in matvec at Multiply.c:82 because of assumed dependencies. If real dependencies are detected, this analysis can provide additional details to resolve those dependencies.
Run a Dependencies Analysis
In the drop
 column in the Survey report, select the checkbox for the loop in matvec at Multiply.c:82.
 In the Vectorization Workflow pane, click the Collect button
 under Check Dependencies to produce a dependencies report.
 Usually, the Dependencies analysis takes a while to generate the report. If analysis time during this exercise is a consideration: click the Stop button
 under Check Dependencies to stop the current analysis once the site coverage progress bar shows 1/1 sites executed. This displays the results collected so far. However, note that outside of this recipe, doing so risks not finding all dependencies (for example, when you have several calls of selected cycles).
Assess Dependencies
In the top pane of the Refinement Reports window, notice that Intel Advisor reports a RAW and a WAW dependency in the loop in matvec at Multiply.c:82. The Dependencies Report tab in the bottom pane shows the source of the dependency: addition in the sumx variable.

The loop in matvec at Multiply.c:82 did not vectorize because of a reduction dependency caused by the addition in sumx. By running the Dependencies analysis, we verified that the dependency is real. The REDUCTION applies an OpenMP* SIMD directive with a reduction clause, so each SIMD lane computes its own sum, and the results are combined at the end. (Applying an OpenMP* SIMD directive without a reduction clause will generate incorrect code.)
Rebuild the solution with the /DREDUCTION option. Re-run the Roofline analysis and save the result as Snapshot_xHost_Reduction.

Observe that the loop in matvec at Multiply.c:82 is now vectorized. The Elapsed time is also improved.
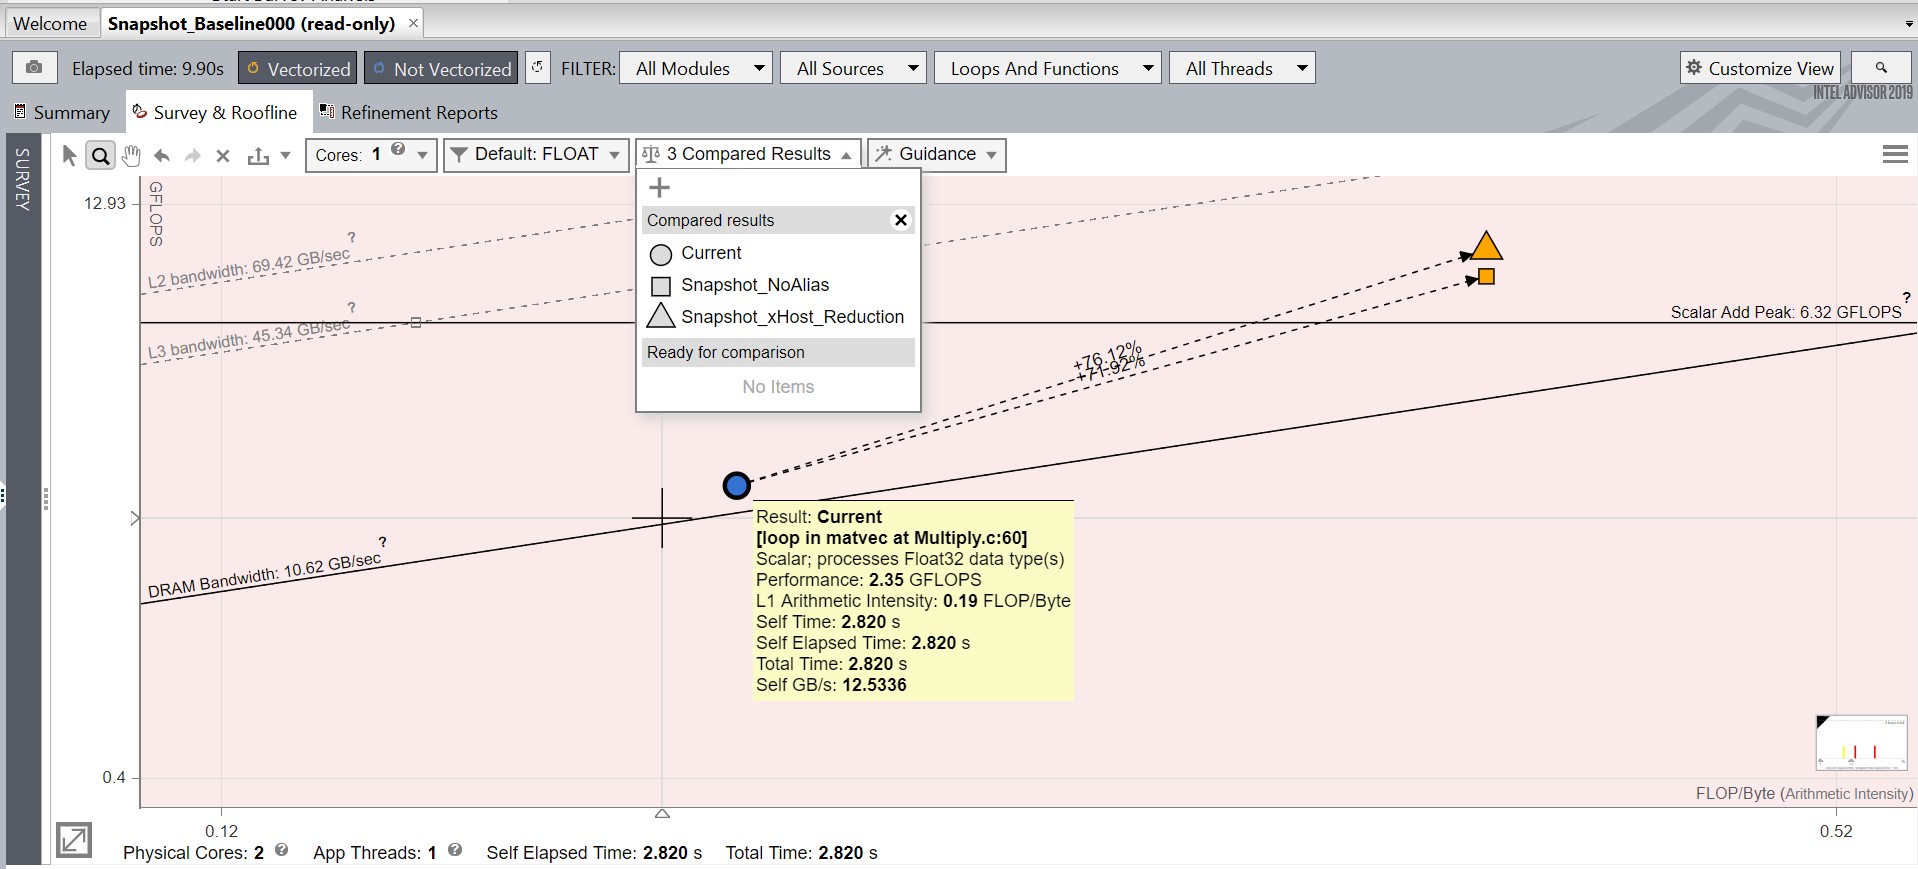
Open the Snapshot_Baseline result and, using the Roofline Compare feature, add Snapshot_NoAlias and Snapshot_xHost_Reduction for comparison.
The image below shows the results: an overall improvement in performance. Please make a note of triangle and square symbols ( and
and  ), which represent loops from Snapshot_xHost_Reduction and Snapshot_NoAlias, respectively. We'll specifically focus on the loop in matvec at Multiply.c:60 using Filter In Selection, as it was the biggest hotspot in Snapshot_Baseline. The latest optimization has pushed the loop further upward. This shows that the runtime of the loop is improving, which is reflected in the overall elapsed time of the code.
Key Takeaways
The Roofline plot in Intel Advisor can be used to visually represent application performance in relation to hardware limitations – memory bandwidth and computational peaks.
Intel Advisor 2019 has a new feature called Roofline Compare, which can be used to see the shift of loops and functions after each optimization effort. With this feature, the process of optimization becomes less challenging, as it helps developers to quantify and visualize their optimization efforts.