Intel® Distribution for Python*
Achieve near-native code performance with this set of essential packages optimized for high-performance numerical and scientific computing.
High-Performance Python
The Intel® Distribution for Python* provides:
- Scalable performance using all available CPU cores on laptops, desktops, and powerful servers
- Support for the latest CPU instructions
- Near-native performance through acceleration of core numerical and machine learning packages with libraries like the Intel® oneAPI Math Kernel Library (oneMKL) and Intel® oneAPI Data Analytics Library
- Productivity tools for compiling Python code into optimized instructions
- Essential Python bindings for easing integration of Intel native tools with your Python project
For more information, see the system requirements.
Develop for Accelerated Compute
Data Parallel Extensions for Python*
Enable standards-based accelerated computing on CPUs and GPUs without using low-level proprietary programming APIs. Optimize performance and portability by extending the familiar CPU programming model to a GPU with a compute follows data model.
Data Parallel Control Library (dpctl)
This library provides utilities for device selection, allocation of data on devices, tensor data structure, the Python* Array API Standard implementation, and support for the creation of user-defined data-parallel extensions.
Data Parallel Extension for NumPy*
This is a drop-in replacement for a subset of NumPy APIs that enable running on Intel CPU and GPUs.
Data Parallel Extension for Numba*
This extension enables you to program GPUs the same way CPUs are programmed with Numba.
Who Needs This Product
AI & Machine Learning Developers
- Build high-performance, end-to-end AI and machine learning pipelines on Intel platforms with the Intel Distribution for Python and the AI Tools. For more information, see AI & Machine Learning.
Analysts, Researchers, and Scientific Computing Developers
- Gain easy access to all CPU cores and GPU accelerated performance with optimizations for NumPy, SciPy, and Numba that scale from laptops up to powerful servers.
High-Performance Computing (HPC) Developers
- Tune for highest efficiency at scale using advanced tools for multithreading and multiprocessing with OpenMP*, tbb4py, smp, and mpi4py.
- Create your own Python libraries and applications that maximize performance using oneMKL, Intel® oneAPI DPC++/C++ Compiler, and Intel® Fortran Compiler runtimes.
Beginners and Students
- Learn how to productively program in Python using standards-based libraries for the highest performance.
Download the Stand-Alone Version
A stand-alone version of Intel Distribution for Python is available.
What's Included
Package and Environment Managers
Get essential tools for installing, updating, and deleting Python packages and environments.
Data Processing and Modeling Packages
Use these packages in numeric and data science workflows for data collection, ingestion, preprocessing, normalization, transformation, aggregation, and analysis.
Machine Learning Packages
Foundational packages that allow a machine to automatically learn from data without programming it explicitly.
Python Interpreter and Compilers
Use these tools for a versatile interactive experience and to achieve scaled performance.
Advanced Programming Packages
Essential packages that enable fine-grained controls for data management, devices management, concurrency, and parallelism.
Development Packages and Runtimes
Use these runtime packages for enabling performance across Intel-optimized Python packages.
Priority Support
Available through the Intel® oneAPI Base Toolkit.
Benchmarks

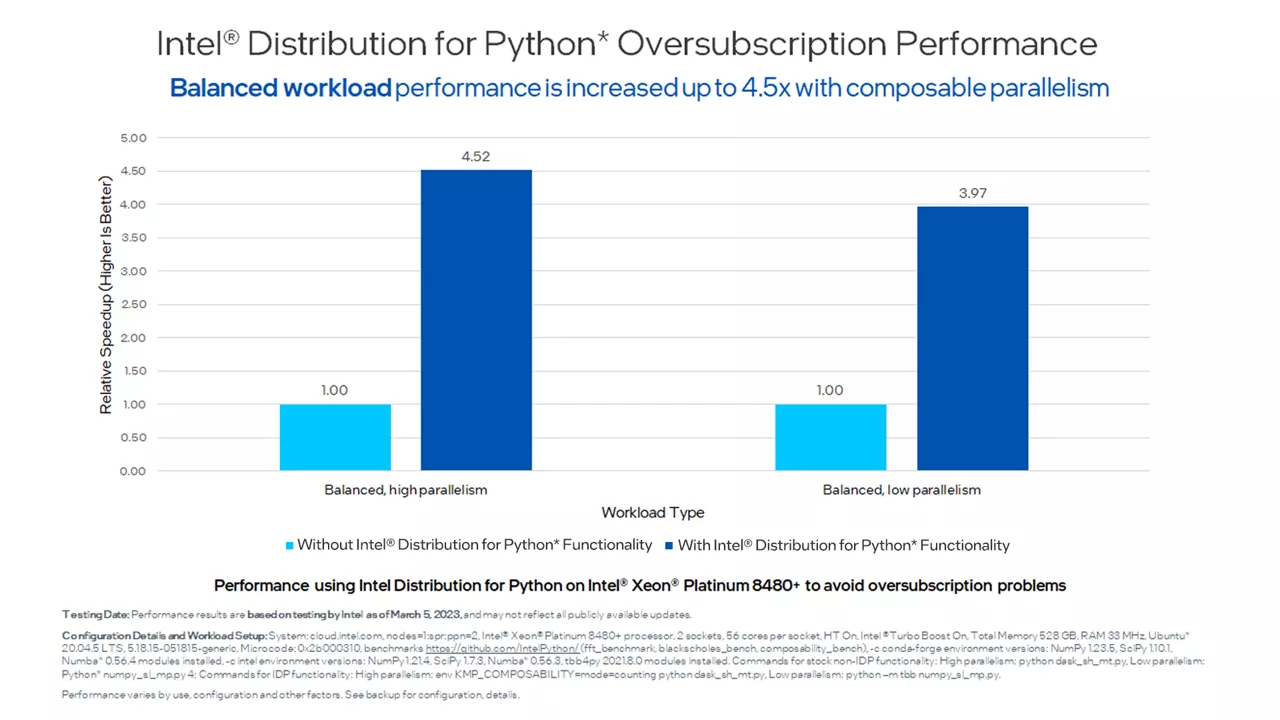
Intel Distribution for Python Oversubscription Performance (successful unbalanced workload performance)
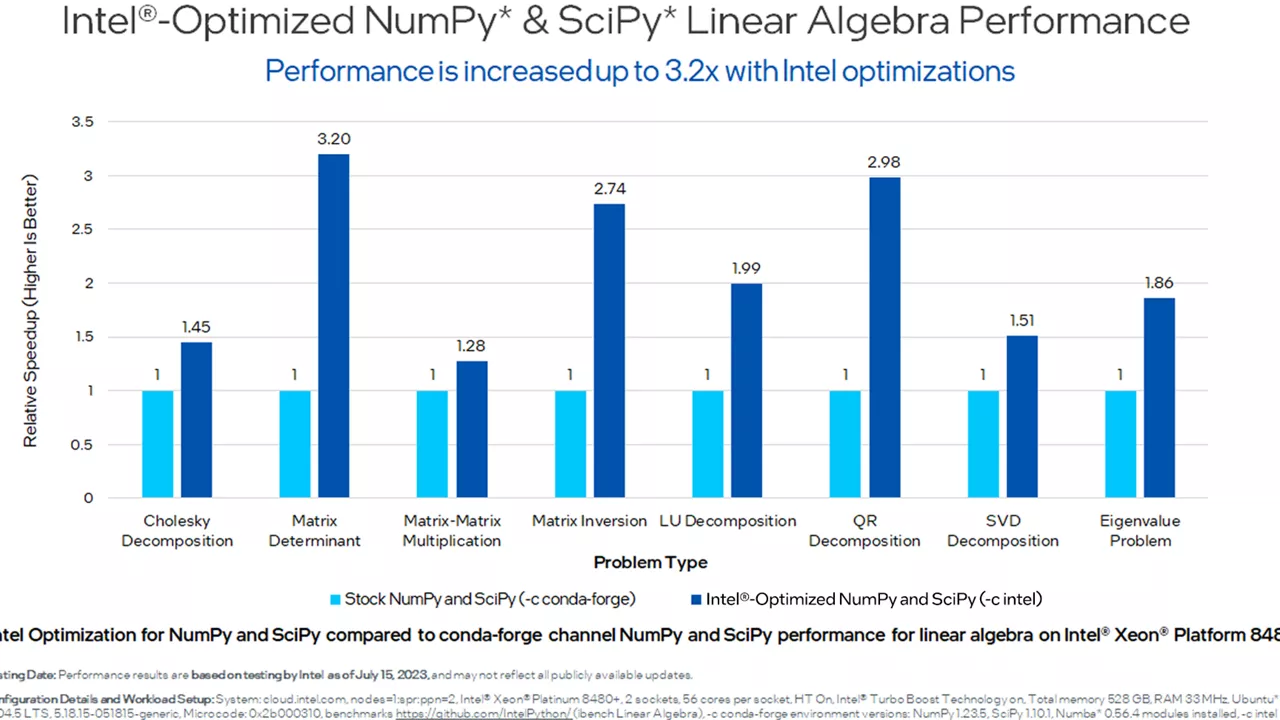
Intel-Optimized NumPy & SciPy Linear Algebra Performance
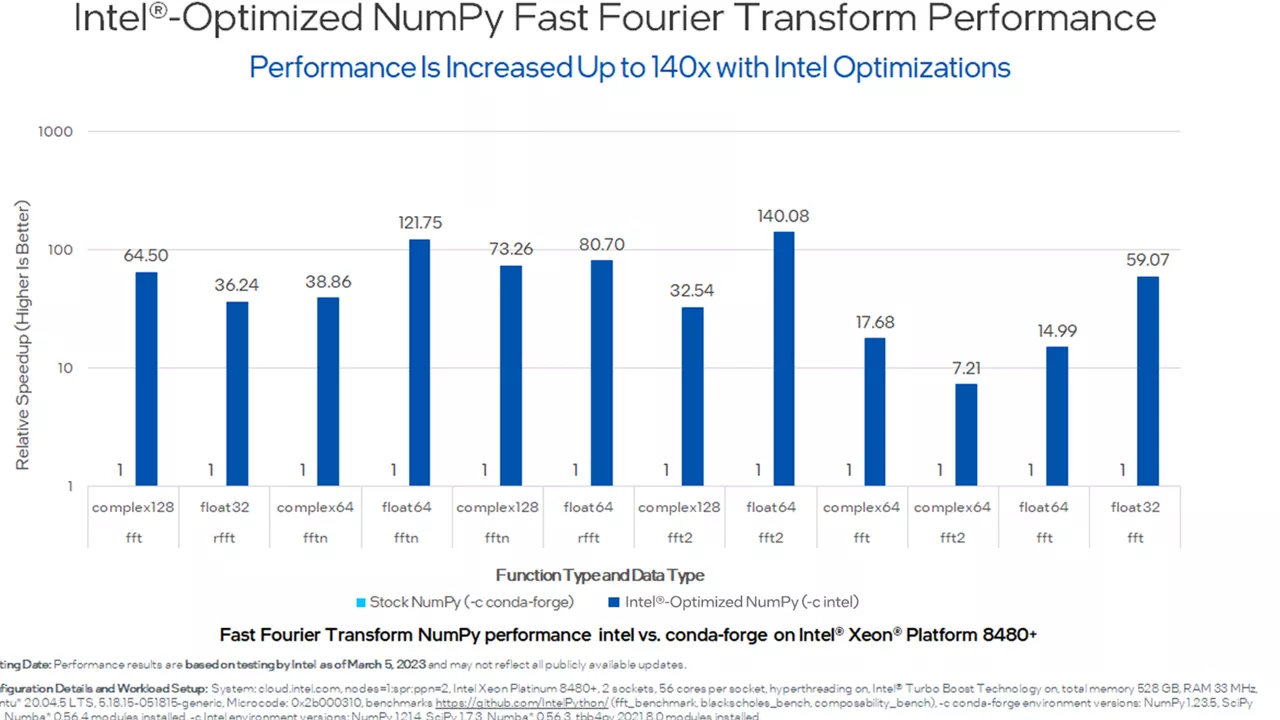
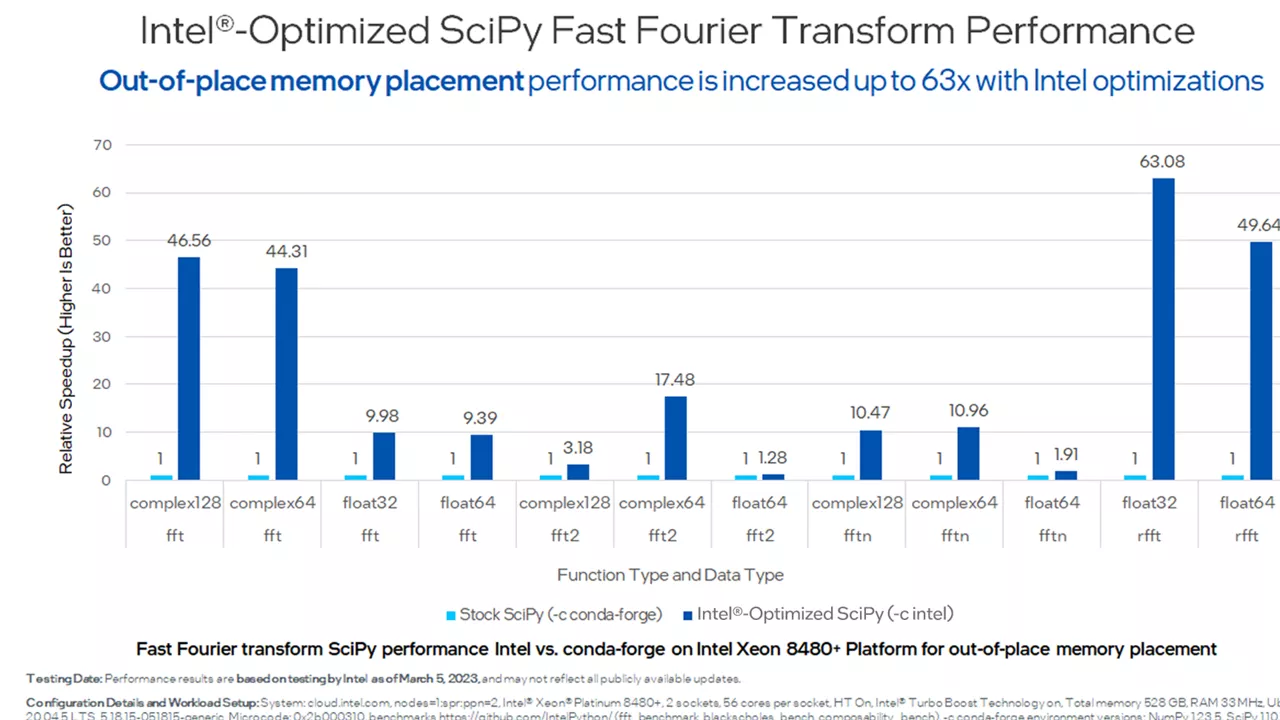
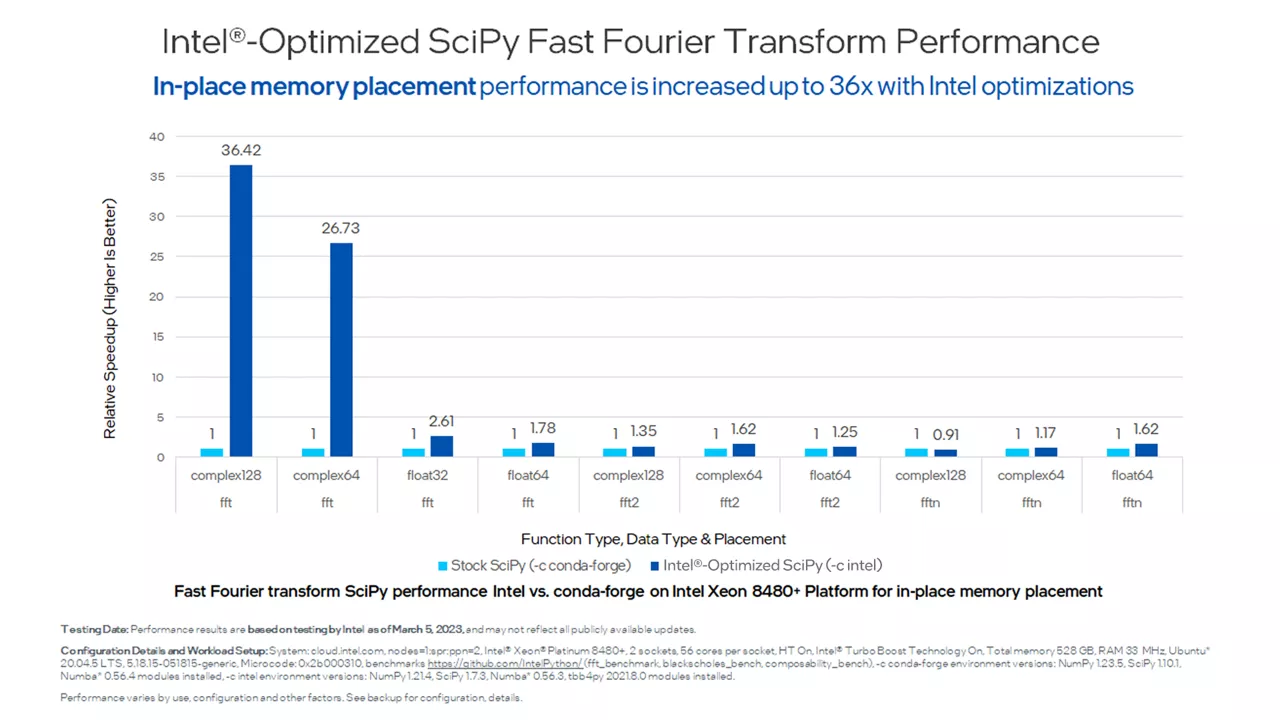
Intel-Optimized NumPy Fast Fourier Transform Performance
Get Help
Your success is our success. Access these support resources when you need assistance.
Stay Up to Date on AI Workload Optimizations
Sign up to receive hand-curated technical articles, tutorials, developer tools, training opportunities, and more to help you accelerate and optimize your end-to-end AI and data science workflows. Take a chance and subscribe. You can change your mind at any time.
