Troubleshooting content to help locate a defective memory module
How do I determine the proper Central Processing Unit (CPU) location (1 or 2) and Dual in-line memory modules (DIMM) bank when there is a suspect, defective memory module?
Proceed as indicated below, which is based on diagnostics steps towards finding the DIMM that is causing an IErr ECC_error:
| Note | Ensure the ipmitool tool (see IPMI, V2.0, Command Test Tool) is loaded on, or available to run on that node. This will allow you to examine the System Event Log (which is a binary). |
| Note |
Examine the System Event Log by looking at the Extended List this way:
#sudo ipmitool sel elist | less
1c | 08/24/2018 | 22:51:49 | Memory Mmry ECC Sensor | Uncorrectable ECC | Asserted
1d | 08/24/2018 | 22:51:49 | Memory Mmry ECC Sensor | Uncorrectable ECC | Asserted Then you can inspect any entry in the System Event Log by referring to the Hexadecimal (HEX) value in the first column: #sudo ipmitool sel get 0x1c
SEL Record ID : 001c Record Type : 02 Timestamp : 08/24/2018 22:51:48 Generator ID : 0033 EvM Revision : 04 Sensor Type : Memory Sensor Number : 02 Event Type : Sensor-specific Descrete Event Direction : Assertion Event Event Data (RAW) : a10103 Event Interpretation : Missing Description : Uncorrectable ECC Sensor ID : Mmry ECC Sensor (0x2) Entity ID : 32.1 (Memory Device) Sensor Type : Memory (0x0c) |
Debug the log location of the Event Data (RAW)
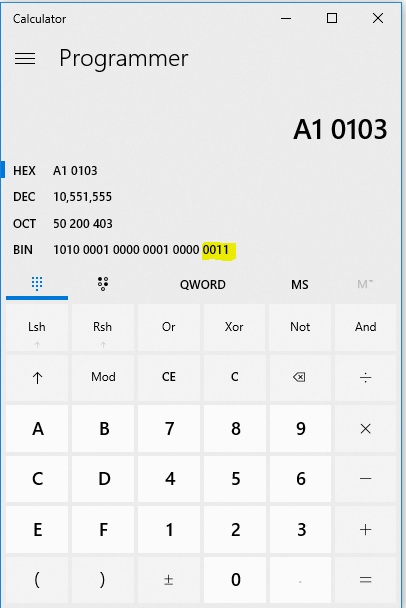
- Enter that number into a calculator:

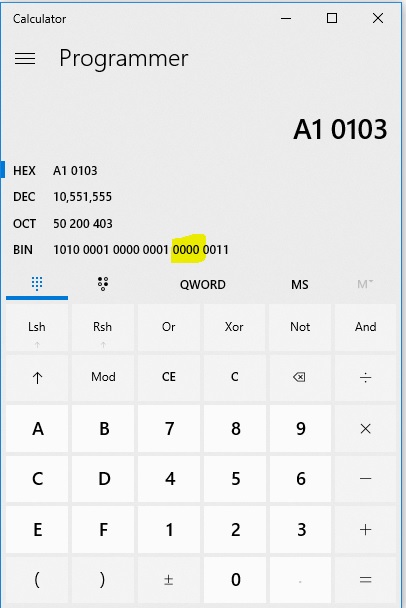
- Look at the Binary (BIN) value, specifically the last 8 bytes. In the image above, look at the right-most bits (as highlighted).
- Convert that to decimal and as the table below indicates, the right-most bits represent the DIMM socket value: 0=A, 1=B, 2=C,3=D, and so on.
The second right-most bits represent the CPU socket.

In this case, b0000 = CPU1. b0001 would equal CPU2.
When using IPMI, it is not possible to get the level of detail as is displayed on the Baseboard Management Controller (BMC) Web Graphical User Interface (GUI). However, you can use Redfish by running the next command: curl -k -u <user>:<password> https://<ip>/redfish/v1/Systems/<serial #>/LogServices/SEL/Entries?$skiptoken=0.
| Note |
skiptoken is where to start from. It will normally return 50 records, so skiptoken will be 0, 50, 100, and so on. At the end of the response, it tells you what the next skiptoken should be to continue reading. |
Alternatively, you can use the Intel® Server Debug and Provisioning Tool (Intel® SDP Tool) from your server manager system running the SDPtool <ipv4> <username> <password> debuglog <filename> command.