Visible to Intel only — GUID: GUID-87BCA263-0834-41CC-8B69-E22CB7459FE6
Visible to Intel only — GUID: GUID-87BCA263-0834-41CC-8B69-E22CB7459FE6
CPU/FPGA Interaction Analysis
Use the CPU/FPGA Interaction analysis to assess the balance between CPU and FPGA in systems with FPGA hardware that run SYCL applications.
Use the CPU/FPGA Interaction analysis to assess FPGA performance of executed kernels, overall time for memory transfers between the CPU and FPGA, and wait time impact on CPU and FPGA workloads.

Intel® VTune™ Profiler collects these FPGA device metrics:
Global Bandwidth
Stalls
Occupancy
Activity
Idle
Configure and Run Analysis
Follow this procedure to configure options for the CPU/FPGA Interaction analysis:
Prerequisites:
- To obtain device side information from the FPGA when profiling, make sure you specify the profile flag for the compile operation. To compile SYCL applications, use the -Xsprofile option with the Intel® oneAPI DPC++/C++ Compiler.
Click the
 (standalone GUI)/
 (Visual Studio IDE)Configure Analysis button on the Intel® VTune™ Profiler toolbar.
 The Configure Analysis window opens.
In the WHAT pane,
Specify the host executable in the Application bar.
If applicable, specify arguments for the host application as Application parameters.

In the HOW pane, click the
 Browse button.
 - Select CPU/FPGA Interaction analysis type from the Accelerators group.
- Enter the CPU sampling interval in milliseconds.
- Specify if the collection should include CPU call stacks.
- Specify a source for the FPGA profiling data:
- OpenCL Profiling API - This source profiles only the host application.
- AOCL Profiler - This source profiles the host application as well as the design on your FPGA.
NOTE:To generate the command line for this configuration, use the
 Command Line button.
 Click the
 Start button to run the analysis.
Import FPGA Data collected with Profiler Runtime Wrapper
If you collected FPGA profiling data with the Profiler Runtime Wrapper in the format of a profile.json file, you can also import it to the VTune Profiler project.
To speed up the loading of the collected data, copy the profile.json to an empty folder and import that folder instead of the entire compilation directory.
See the FPGA Optimization Guide for information on generating the profiling data with the Profiler Runtime Wrapper (oneAPI applications only).
View Data
The CPU/FPGA Interaction analysis results appear in the CPU/FPGA Interaction viewpoint. The viewpoint contains these windows:
The Summary window displays statistics on the overall application execution, identifying CPU time and processor utilization, and execution time for SYCL kernels. Double click a kernel in the Bottom-up view to see detailed performance data through the Source view.
The Bottom-up window displays functions in the Bottom-up tree, CPU time and CPU utilization per function. Click the functions or kernels in this view to see the Source view.
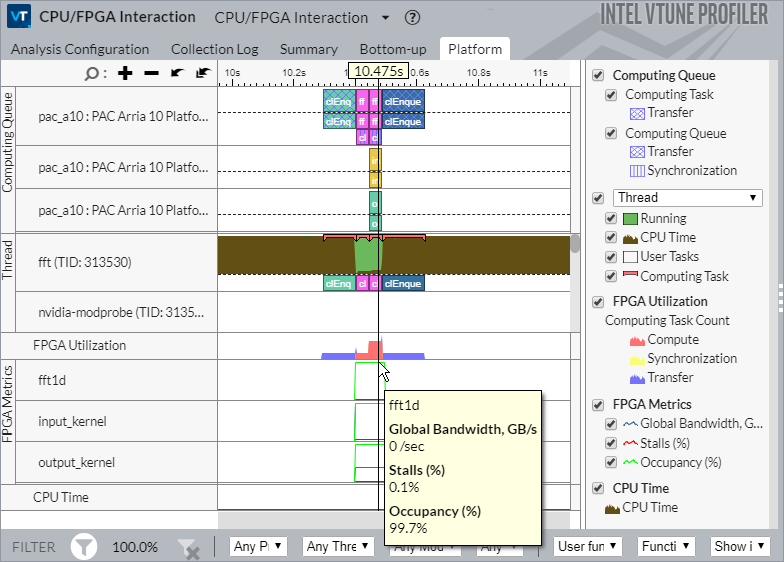
The Platform window displays over-time metric and performance data for SYCL kernels, memory transfers, CPU context switches, FPU utilization, and CPU threads with SYCL kernels.
What's Next
Use the CPU/FPGA Interaction viewpoint to review the following:
FPGA Utilization: Look at the FPGA Top Compute Tasks on the Summary window for a list of kernels running on the FPGA. The Bottom-up window shows the Total and Average execution time for every kernel.
Memory Transfers: Look at the Data Transferred column on the Bottom-up window or the Computing Queue rows on the Platform window to view SYCL kernels and memory transfers.
Workload Impact: The Context Switch Time metric on the Summary window shows how much time was spent in CPU context switches. Context switches can also be seen on the Platform tab as they occurred during application execution.