Effective Utilization of Intel® Data Direct I/O Technology
Use Intel® VTune™ Profiler to understand the utilization efficiency of Intel® Data Direct I/O (Intel® DDIO) technology, a hardware feature of Intel® Xeon® processors.
Content Expert: Alexander Antonov, Eugeny Parshutin
Traditionally, inbound PCIe transactions target the main memory. Data movement from the I/O device to the consuming core requires multiple DRAM accesses. For I/O-intensive use cases like software data planes, this scheme becomes inapplicable.
For example, when a 100G NIC is fully utilized with 64B packets and 20B Ethernet overhead, a new packet arrives every 6.72 nanoseconds on average. If any component on the packet path takes longer than this time to process the individual packet, a packet loss occurs. For a core running at 3GHz, 6.72 nanoseconds only accounts for 20 clock cycles, while the DRAM latency is 5-10 times higher, on average. This is the main bottleneck of the traditional DMA approach.
The Intel® DDIO technology in Intel® Xeon® processors eliminates this bottleneck. Intel® DDIO technology allows PCIe devices to perform read and write operations directly to and from the L3 cache, or the last level cache (LLC). This places the incoming data as close to the cores as possible. With proper use of Intel DDIO technology, the core and I/O device interactions are completely served by using the L3 cache. This results in some benefits:
There is no longer a need for DRAM accesses.
There are low inbound read and write latencies that allow for high throughput.
The DRAM bandwidth and power consumption are both reduced.
Though Intel® DDIO is a hardware feature that is always enabled and transparent to software, improper use can cause suboptimal performance. To optimize the use of Intel® DDIO, there are two main software tuning opportunities:
Topology configuration: For a system with multiple sockets, it is critical that all of the following are on the same NUMA mode:
- I/O device
- Core that interfaces with the I/O device
- Memory
L3 cache management: Advanced tuning helps to optimize the usage of L3 cache by keeping the necessary data available in the L3 cache at the right time.
This recipe demonstrates how you use the Input and Output analysis in VTune Profiler to detect inefficiencies in the use of Intel® DDIO technology.
Directions:
Ingredients
System: A two-socket 2nd Generation Intel® Xeon® Scalable processor-based system.
Application: DPDK testpmd application configured to run on a single core and to perform packet forwarding using one port of one 40G network interface card attached to Socket one.
Performance Analysis Tool:Intel® VTune™ Profiler version 2024 or newer (Input and Output analysis)
Understand the Architectural Background
In Intel® Xeon® Scalable processors, the L3 cache is a resource that is shared between all cores and all Integrated I/O controllers (IIO) within a single socket. Data transfers between the L3 cache and the cores are performed with cache line granularity (64B). When a PCIe device makes a request to the system memory, IIO translates this request into one or multiple cache line requests and issues them to the L3 cache on the local socket. A request to local L3 cache can happen in these ways:
Inbound PCIe write request
Inbound PCIe write L3 hit: In the ideal case, an address targeted by a write request is already cached in the local L3. The cache line in the L3 is then overwritten with the new data.
Inbound PCIe write L3 miss: The scenario you want to avoid has an address that is targeted by the write request and is not cached in the local L3. In this case, a cache line is first evicted from an L3 way dedicated for I/O data. This could lead to DRAM write-back if the evicted line was in a dirty state. Then, in place of the evicted line, a new cache line is allocated. If the targeted cache line is cached remotely, cross-socket accesses through the Intel® Ultra Path Interconnect (Intel® UPI) are required to enforce coherency rules and to complete the cache line allocation. Finally, the cache line is updated with the new data.
Inbound PCIe read request
Inbound PCIe read L3 hit: In the ideal case, an address targeted by a read request is cached in the local L3. The data is read and sent to the PCIe device.
Inbound PCIe read L3 miss: In the scenario you want to avoid, an address targeted by a read request is not cached the local L3. In this case, the data is read from the local DRAM or from the remote socket's memory subsystem. No local L3 allocation is performed.
For the 1st and 2nd Generation Intel® Xeon® Scalable processors, the Input and Output analysis in VTune Profiler provides Intel® DDIO utilization efficiency metrics including:
- L3 hit/miss ratios
- Average latencies of inbound PCIe reads and writes
Analyze Intel DDIO Traffic
- Make sure to use 1st or higher generations of Intel® Xeon® Scalable processors.
- Check to confirm that the sampling driver is loaded.
- Plan to collect data for at least 20 seconds.
This procedure uses the Input and Output analysis in VTune Profiler to collect Intel DDIO utilization efficiency metrics. When you run the analysis in driverless mode, there may be some limitations.
In the WHAT pane, do one of the following:
- Select Launch Application and specify the path to the application and any parameters.
- Select Attach to Process and specify the PID
In the HOW pane, select the Input and Output analysis.
Check the Analyze PCIe traffic checkbox to collect Intel DDIO utilization efficiency metrics.

Click the
 Start button to run the analysis.
Understand Typical Examples
To understand typical inefficient usages of Intel DDIO technology and the capabilities of VTune Profiler that help to highlight them, run the DPDK testpmd application on a two-socket system equipped with 2nd Generation Intel® Xeon® Scalable processors. The application is configured to run on a single core and to perform packet forwarding using one port of a single 40G NIC attached to Socket 1.
The traffic generator injects 64B packets into the system with a packet rate that is much higher than what a single core can process. The optimization criterion is the system throughput - higher throughput indicates increased optimization . For this configuration, the experiment identifies the single core application throughput.
As a single baseline for two examples below, use a configuration where a core from Socket 1 performs packet forwarding. This configuration is called local, since the core and PCIe device reside on the same socket.
# ./testpmd -n 4 -l 24,25 -- -i
testpmd> set fwd mac retry
testpmd> start
Use the mac forwarding mode. In this mode, a core changes the source and the destination Ethernet addresses of packets. Thus the forwarding core accesses packet descriptors and touches each packet.
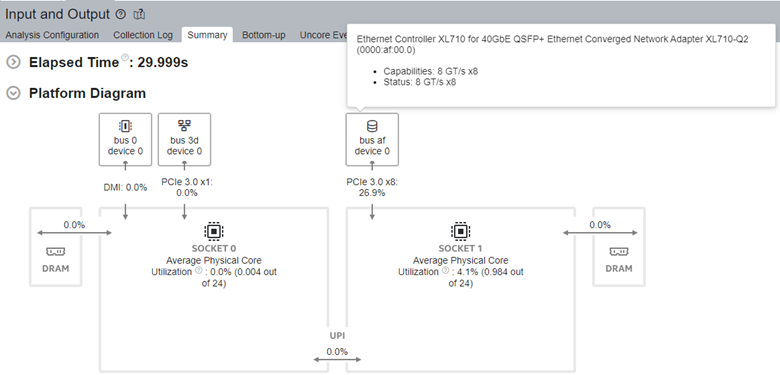
Run the Input and Output analysis. Once the results display, look at the Platform Diagram in the Summary window.
The Platform Diagram shows the system topology and indicates an average utilization of hardware resources:
- Physical cores by computations of the workload being analyzed
- DRAM
- Intel® UPI and PCIe links

In the Summary tab, see the PCIe Traffic Summary section. You see the total inbound and outbound PCIe read and write traffic as first-level metrics. Intel DDIO utilization efficiency indicators appear as second-level metrics:
L3 Hit/Miss Ratios represent a portion of inbound requests that hit/miss the L3 cache.
Average Latency shows the average amount of time the platform spent on handling inbound requests for a cache line.
Core/IO Conflicts metric shows the ratio of inbound writes that experience cache line contentions. When detected, VTune Profiler suggests a possible tuning direction.
To see detailed IO metrics, click any metric in the PCIe Traffic Summary section to switch to the Bottom-up pane:

To see PCIe metrics, select the Package/M2PCIe grouping in the Grouping drop-down menu. This grouping breaks down the metrics by sockets. The M2PCIe blocks are named by the PCIe devices they serve. If M2PCIe manages more than one device, the device names are display in a comma-separated list. Hover over a cell to see all devices.
To see Intel DDIO utilization efficiency metrics, expand the second level. Click the Expand button on each column.

Check the Platform tab to see DRAM and Intel UPI bandwidth details.
Remote Socket Accesses
This first experiment demonstrates a suboptimal application topology that results in these conditions:
- High DDIO miss rate
- Higher DDIO latency
- Induced DRAM and Intel® Ultra Path Interconnect (Intel® UPI) traffic
This is an example of a suboptimal topology that uses a remote configuration with the forwarding core and the NIC residing on distinct sockets:
# ./testpmd -n 4 -l 0,1 -- -i
testpmd> set fwd mac retry
testpmd> start
Now, re-run the analysis in the Attach to Process mode, using the graphical interface or the command line:
# vtune -collect io --duration 20 --target-process testpmd
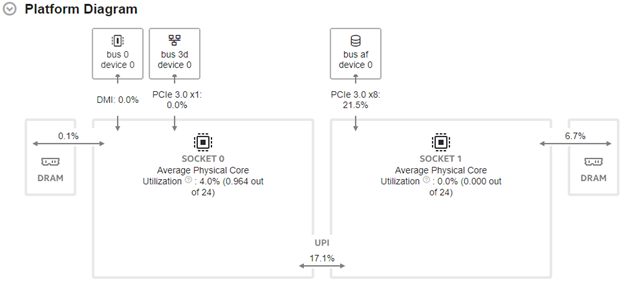
The Platform Diagram reveals issues with topology:
Core utilization on a distinct socket with regard to NIC
Non-zero DRAM and UPI utilization

Examine the results:
| Forwarding core ID | Throughput, Mpps | Inbound PCIe Read L3 Miss, % | Average Inbound PCIe Read Latency, ns | Inbound PCIe Write L3 Miss, % | Average Inbound PCIe Write Latency, ns |
|---|---|---|---|---|---|
| 25 | 21.1 | 0 | 112 | 0 | 135 |
| 1 | 17.1 | 100 | 320 | 100 | 240 |
A configuration where the forwarding core and the NIC reside on distinct sockets demonstrates worse performance with a 100% L3 miss rate and higher latency for inbound PCIe requests.
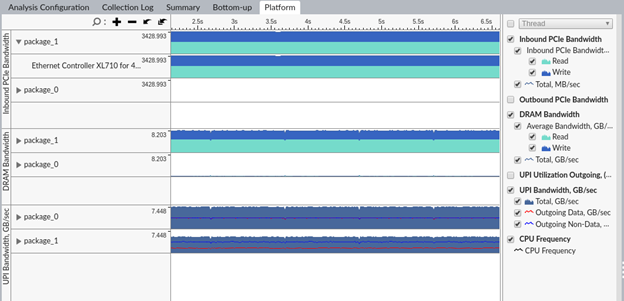
To understand the implications of high miss rates in the remote case, switch to the Platform pane:

There is high UPI and DRAM bandwidth. To get a holistic view, analyze the configuration from the core perspective by using the Memory Access analysis:
# vtune -collect memory-access -knob dram-bandwidth-limits=false --duration 20 --target-process testpmd

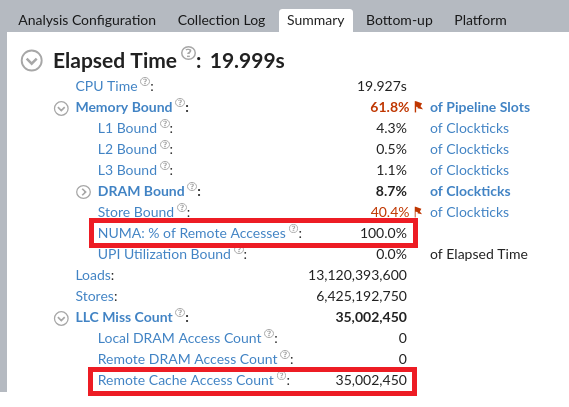
From the VTune Profiler results, we see in the remote configuration that CPU cores suffer from remote accesses. These are due to LLC misses that get resolved by taking the data from the remote L3 cache.
Navigate to the Bottom-up pane to determine which cores, processes, threads, or functions accessed the remote LLC:

You can see that all of the remote LLC accesses are induced by the testpmd application running on Core 1 from Socket 0.
Now you can recreate what is happening in the remote configuration. There is zero DRAM bandwidth on Socket 0. Therefore, all the memory consumed by the application and used for descriptor and packet rings, is allocated on Socket 1 locally to the NIC. When the forwarding core from Socket 0 accesses descriptors and packets, the core misses LLC on Socket 0.Snoop requests are sent to bring the data from Socket 1, which induces UPI traffic. If these requests find modified data in the LLC of Socket 1, a DRAM write-back occurs. This write-back contributes to the measured DRAM bandwidth.
When the device accesses the same locations again, it misses the L3 cache on Socket 1. This is because the data was last used by a core on Socket 0 and remains there. So the memory directory is accessed to determine the socket where the address could be cached. This action also contributes to the observed DRAM bandwidth. This time, the snoop requests travel from Socket 1 to Socket 0 to enforce coherency rules and to complete the I/O request.
As a result, you observe these values from the data collected by the Input and Output and Memory Access analyses:
| Forwarding core ID | Throughput, Mpps | Inbound PCIe Read L3 Miss % | Average Inbound PCIe Read Latency, ns | Inbound PCIe Write L3 Miss % | Average Inbound PCIe Write Latency, ns | testpmd: LLC Miss Count | testpmd: Remote Cache Access Count | Total DRAM bandwidth (Socket 1), GB/s | Total UPI bandwidth, GB/s |
|---|---|---|---|---|---|---|---|---|---|
| 25 | 21.1 | 0 | 112 | 0 | 135 | 0 | 0 | 0 | 0 |
| 1 | 17.1 | 100 | 320 | 100 | 240 | 35M | 35M | 8 | 12.6 |
In addition to lower throughput caused by higher request latencies, suboptimal application topology causes the system to waste DRAM bandwidth, UPI bandwidth, and platform power.
Poor L3 Cache Management
This second experiment introduces several serious performance issues where, even in the absence of remote socket accesses, the performance is limited. This is due to suboptimal management of I/O data in the LLC, as shown by DDIO misses.
To demonstrate an example using DPDK testpmd, disable the software-level caching of memory pools ( DPDK Mempool Library) that are used as packet rings. Using this default caching mechanism, a core receives a new packet. For the data destination, the core uses a “warm” memory pool element, which most likely resides in hardware caches. Therefore, there are no L3 misses for Inbound PCIe reads and writes, even with packet ring size going above L3 capacity.
Run testpmd with --mbcache=0 option to disable memory pools software caching:
# ./testpmd -n 4 -l 24,25 -- -i --mbcache=0
testpmd> set fwd mac retry
testpmd> start
Compare testpmd performance for the initial local configuration and the same configuration, but with disabled software caching of memory pools:
| Mempool cache enabled | Throughput, Mpps | Inbound PCIe Read L3 Miss % | Average Inbound PCIe Read Latency, ns | Inbound PCIe Write L3 Miss % | Average Inbound PCIe Write Latency, ns | Total DRAM bandwidth (Socket 1), GB/s |
|---|---|---|---|---|---|---|
| Yes | 21.1 | 0 | 112 | 0 | 135 | 0 |
| No | 20.2 | 0 | 115 | 54 | 178 | 4.7 |
When the application is running without memory pool caching optimization, a significant portion of inbound PCIe write requests misses the L3.
To forward one packet, the NIC and the core communicate through the packet descriptor and packet rings. On the data path, the NIC uses inbound PCIe writes to write a packet and update packet descriptors. To learn more, see PCIe Traffic in DPDK Apps.
Descriptor rings are always accessed by a core before I/O, so the probability of an I/O L3 miss on descriptor access is low. But the packet ring is accessed first by the NIC, so all the inbound PCIe write L3 misses are caused by the NIC writing packets to the packet ring at the Rx stage. At the same time, no inbound PCIe read L3 misses are observed, because DPDK follows a zero-copy policy for network data, and once the NIC attempts to take a packet and perform Tx, a packet is already cached.
In conclusion, when packet ring software caching is disabled, packet ring accesses should suffer from hardware cache misses. However, as this recipe demonstrates, you can understand what data was accessed by I/O, resulting in a DDIO miss.
The implications of inbound PCIe request L3 misses in this case are the DRAM bandwidth induced by write-backs from the L3, L3 allocations, and memory directory accesses.
Inferences
Intel® DDIO technology enables software to fully utilize high-speed I/O devices. However, software may not fully benefit from Intel DDIO due to a suboptimal application topology in NUMA systems and/or poor management of data in the L3 cache. This can lead to high L3 access latencies and unnecessary DRAM traffic. Analysis types in VTune Profiler like Input and Output, Memory Access, and Microarchitecture Exploration highlight these inefficiencies and help create a holistic picture from both the core and I/O perspectives.
While the problem of a wrong application topology has an obvious solution, developing an efficient L3 utilization scheme may be more complicated. Several approaches can help design such a scheme and increase performance:
Choose buffer sizes that are less than LLC capacity.
Recycle buffer elements.
Use software prefetching of locations used by the device.
Use L3 partitioning with Intel Cache Allocation Technology (CAT).
Discuss this recipe in the Analyzers forum.