2.9. Generating the EMIF Design Example with the Performance Monitor
You can use the Performance Monitor (PMON) to check the performance metrics of the EMIF interface.
The Performance Monitor is a synthesizable block consisting of control and status registers that let you configure and modify the performance metrics of the EMIF Interface. The Performance Monitor allows you to measure the following performance metrics:
- Read latency
- Write latency
- Read efficiency
- Write efficiency
- Overall efficiency
- Subchannel efficiency
- Subchannel back pressure
- Expected transactions in subchannel
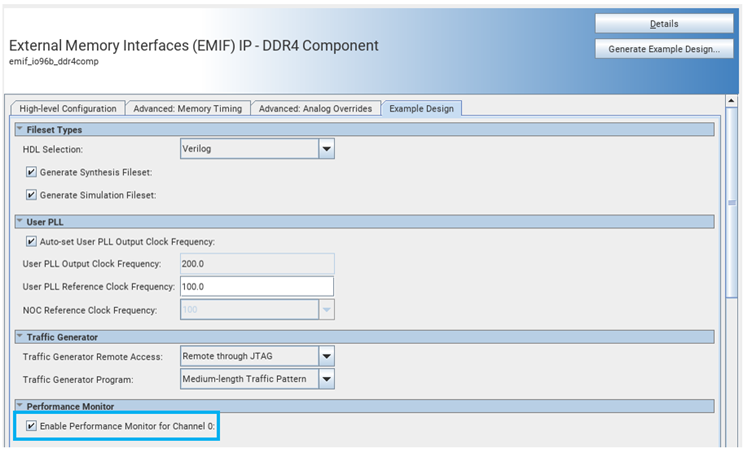
Figure 18. Enabling the Performance Monitor in the EMIF IP


Note: Do not run any traffic on the interface that PMON is monitoring, while you are configuring PMON. Failure to observe this restriction can result in inaccurate measurements.
To generate a design example with the Performance Monitor, follow these steps:
- When generating your design example, set the Enable Performance Monitor parameter to True. This includes the Performance Monitor FPGA IP, which allows you to measure performance on an AIX4 mainband interface.
- Open the generated design example and navigate to the Quartus® Prime Pro Edition software folder containing the design example directory:
<project_directory>/<example_design_directory>/qii/ed_synth.qpf
- Make the necessary pin assignments in the .qsf file or by using the Pin Planner and compile the design by clicking . This generates a .sof file, which you can configure into hardware.
- Open the System Console from the Quartus® Prime Pro Edition software by clicking Load Design.
Figure 19. Load Design

- Load the pmon_library.tcl file in the system console by typing the following command:
source pmon_library.tcl
- Load the testengine_library.tcl file in the system console by typing the following command:
source testengine_library.tcl
- Set the metric configuration on desired AXI4 performance monitors:
- To monitor the read latency only:
pmon_set_all basic_ro
- To monitor the write latency only:
pmon_set_all basic_wo
- To monitor read and write latency only:
pmon_set_all basic_rw
- To monitor read latency, write latency, average number of transactions per cycle:
pmon_set_all basic_eff
- For more information on the configurations that you can monitor, use the following command to access to all the metric configurations:
pmon_help config
- To monitor the read latency only:
- Clear the counters and internal state of all performance monitors by typing the following command:
pmon_reset_counter_data_all
- Reset the state of the drivers by typing the following command:
testengine_reset
- Run traffic over the interface by typing the following command:
testengine_run
- Read the efficiency metrics on the AXI4 performance monitor by typing:
pmon_read_all
Successful reading of performance metrics produces results similar to that shown below:Figure 20. Performance Monitor (PMON) Results