Intel® Graphics Performance Analyzers
Get Started Guide
Overview
Use this documentation to get started with Intel® Graphics Performance Analyzers (Intel® GPA), which is a toolset for graphics performance analysis and optimization of games and other graphics-intensive applications. Intel® GPA is available on Windows* host.
For Chinese version of this document, refer to Get Started with Intel® Graphics Performance Analyzers - Simplified Chinese.
Download Intel GPA
To download Intel GPA, visit the download page. For installation instructions, refer to Install and Launch Intel® GPA.
Supported Graphics APIs
API |
Windows* Host |
|---|---|
Microsoft DirectX* |
yes |
Vulkan* |
yes |
OpenGL* |
yes* |
OpenCL™ |
yes* |
Intel® Media SDK |
yes* |
Intel® Video Processing Library (Intel® VPL) |
yes* |
*on Windows OS, OpenGL, OpenCL, Intel® Media SDK, and Intel® VPL support is limited to Trace mode.
For details on software and hardware requirements for Intel® GPA, see the product Release Notes.
Understand the Workflow
Intel GPA includes four tools:
Use Graphics Monitor as a starting point: navigate to your application, configure options, capture frame, stream, and trace files, launch real-time analysis.
With System Analyzer, analyze CPU, GPU, and graphics API metrics in real time.
With Graphics Trace Analyzer, analyze graphics application execution on the CPU and GPU.
With Graphics Frame Analyzer, analyze streams and frames, including API calls and graphics resources.
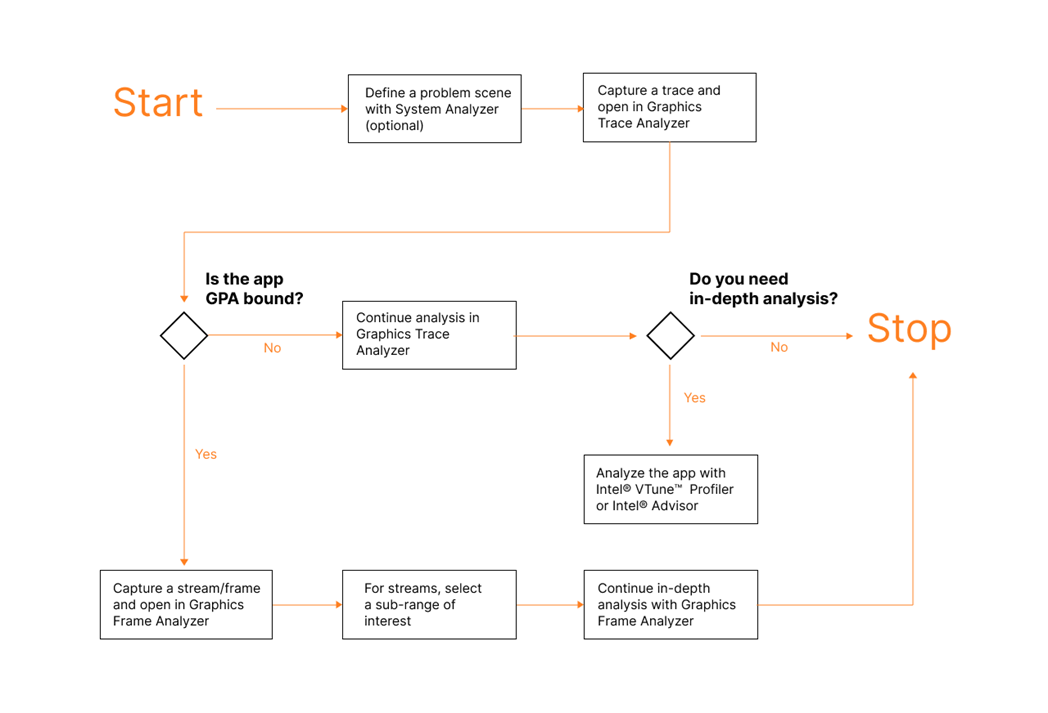
To get started with Intel GPA, you can deep dive into the tool you are interested in, or follow the general workflow:
