Optimize Sampler
Sampling is the process of fetching a value from a texture at a given position. You can configure multiple sampling parameters, such as filtering mode, to balance visual results and sampling performance.
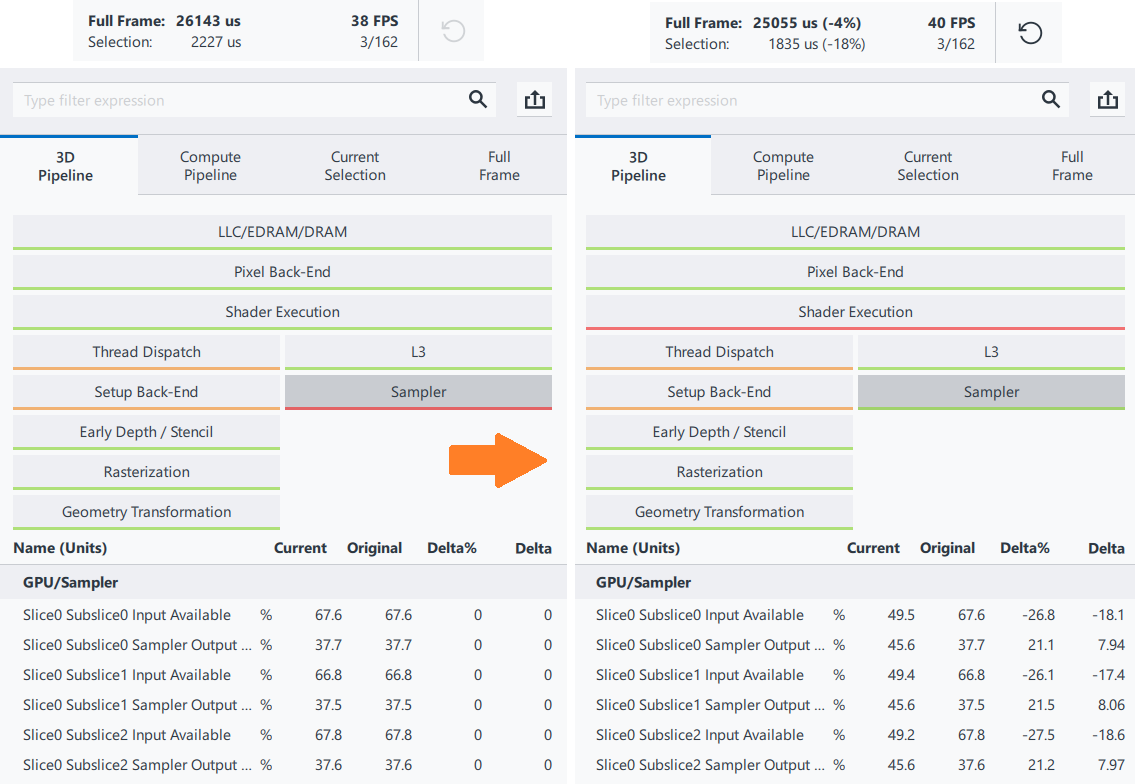
Intel® GPAGraphics Frame Analyzer checks the difference between the percentage of time when a Sampler Input is available and the percentage of time when a Sampler Output is ready.
| Metric Name | Description |
|---|---|
| GPU / Sampler : Slice <N> Subslice<M> Sampler Input Available | Percentage of time there is input from the EUs on slice ‘N’ and subslice ‘M’ to the sampler. |
| GPU / Sampler : Slice <N> Subslice<M> Sampler Output Ready | Percentage of time there is output from the sampler to EUs on slice ‘N’ and subslice ‘M’. |
When Input Available is >10 percent greater than Output Ready for a subslice of a given slice, the sampler is not returning data back to the EUs as fast as it is being requested. The sampler is probably the hotspot. This comparison only indicates a primary hotspot when the samplers are relatively busy, which means that both EU Occupancy and EU Stall are relatively high.
Ingredients
To optimize a Sampler bottleneck, you need the following:
- Application: Unreal Engine 4* Sun Temple sample, DirectX SDK* CascadedShadowMaps11 sample
- Tool: Intel® GPAGraphics Frame Analyzer
NOTE:
To download a free copy of the Intel® Graphics Performance Analyzers toolkit, visit the Intel® GPA product page.
- Operating System: Windows* 10
- GPU: Intel® Processor Graphics Gen9 and higher
- API: DirectX* 11
Optimize Sampler Bottleneck with Graphics Frame Analyzer
There can be multiple reasons for the sampler to be a hotspot. To speed up the sampler, you can try the following:
- Reduce the texture size.
- Change a filtering mode.
- Choose a texture format with a smaller amount of data for a pixel or an uncompressed texture format, if possible. In some cases, the uncompressed format may cause a new bottleneck for larger textures.
- Reduce the number of surfaces on the screen where the texture is applied.
- Adjust the sampling access pattern to make an access to the texture more linear.
With Intel® GPAGraphics Frame Analyzer you can optimize the Sampler bottleneck with real-time experiments, such as changing texture size and filter parameters in a pixel shader.
Reduce Texture Size
To reduce the texture size, do the following:
- Open the event with the discovered Sampler bottleneck in the Graphics Frame Analyzer Resource Viewer by selecting this event on the Main bar chart.
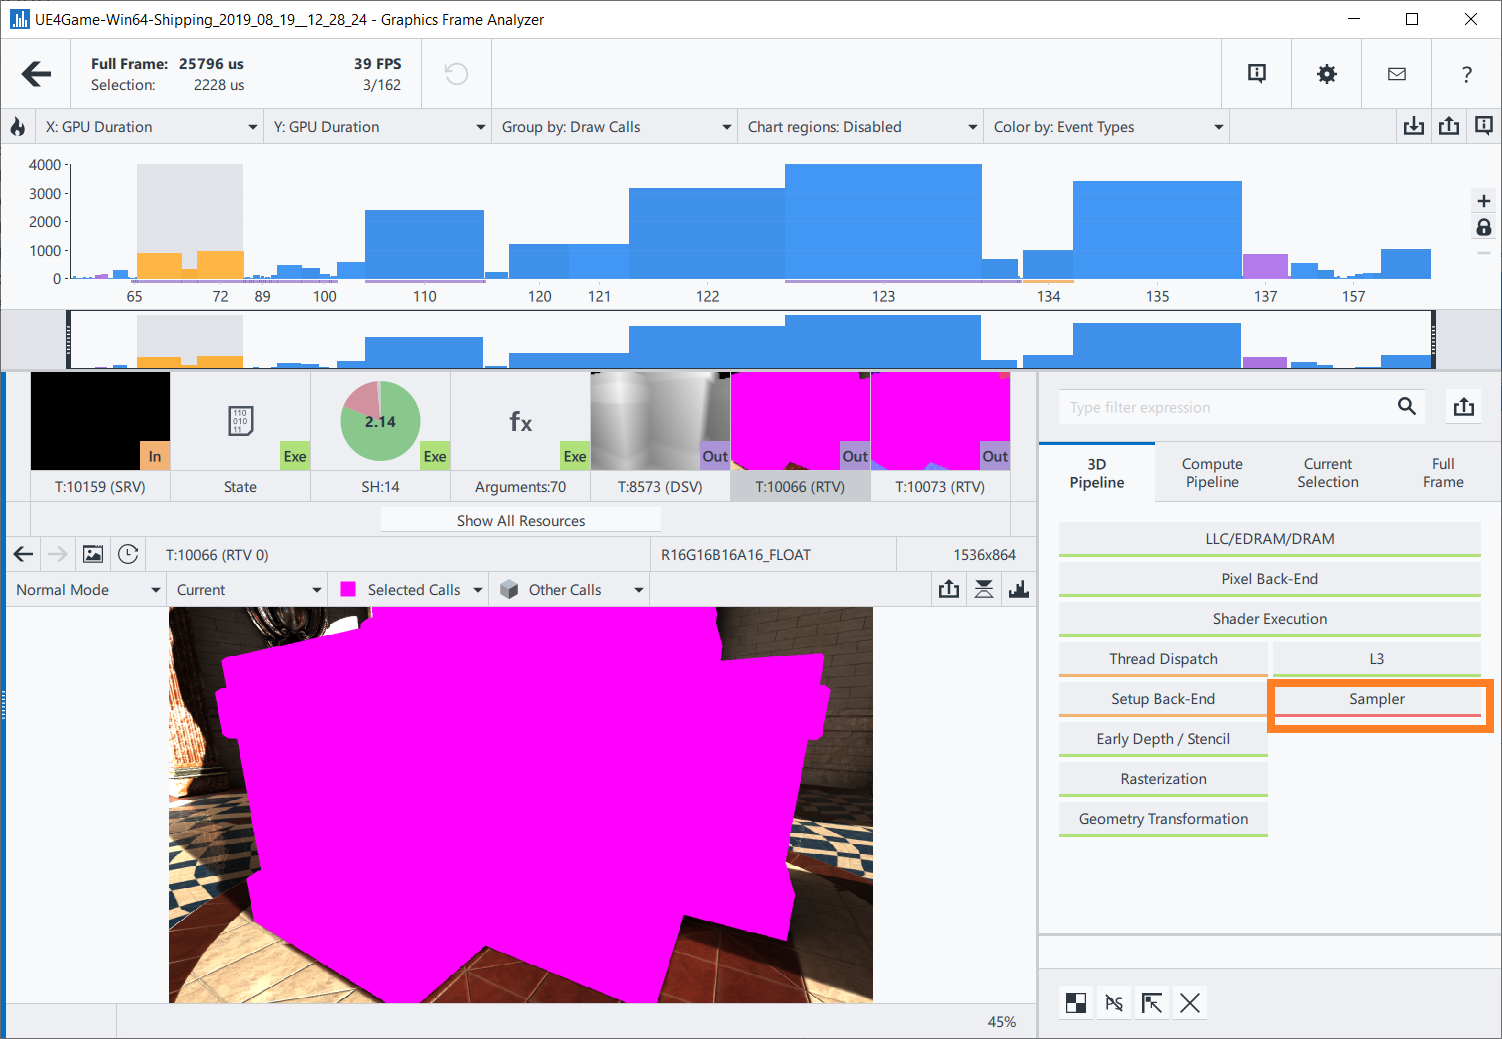
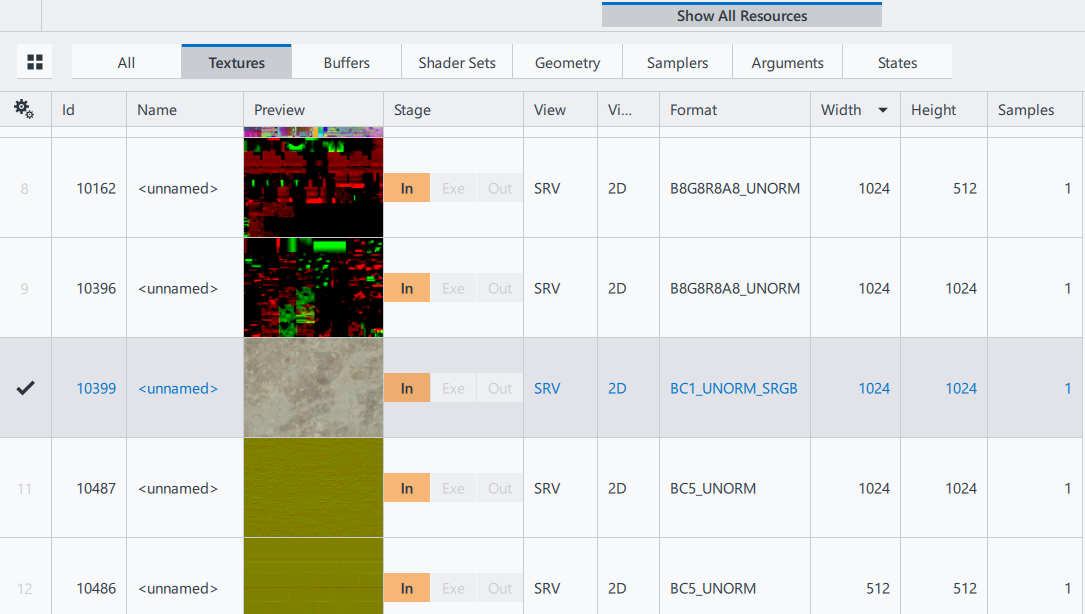
- Click the Show All Resources button, and then click the Textures tab to open the list of sampled textures.
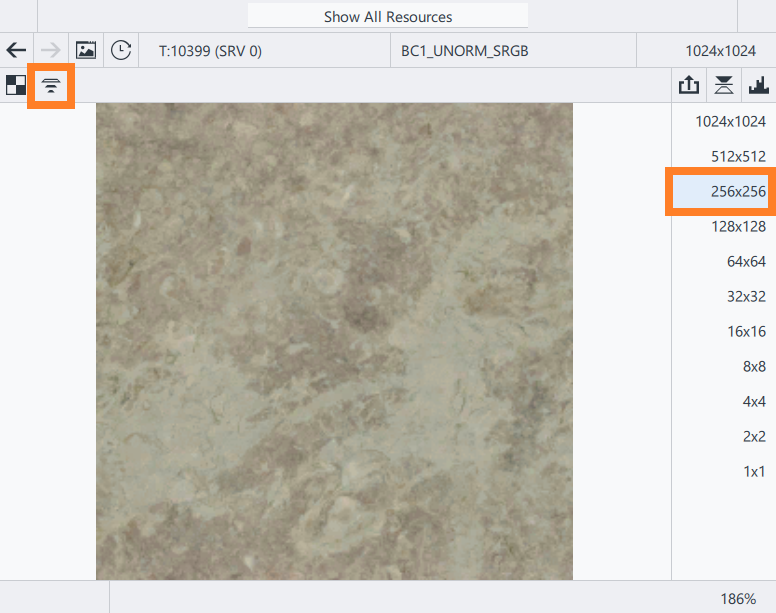
- Reduce the size of one or more large textures. For example, the marble texture size is 1024x1024 pixels. Select a smaller size, for example 256x256, and then click the
 button.
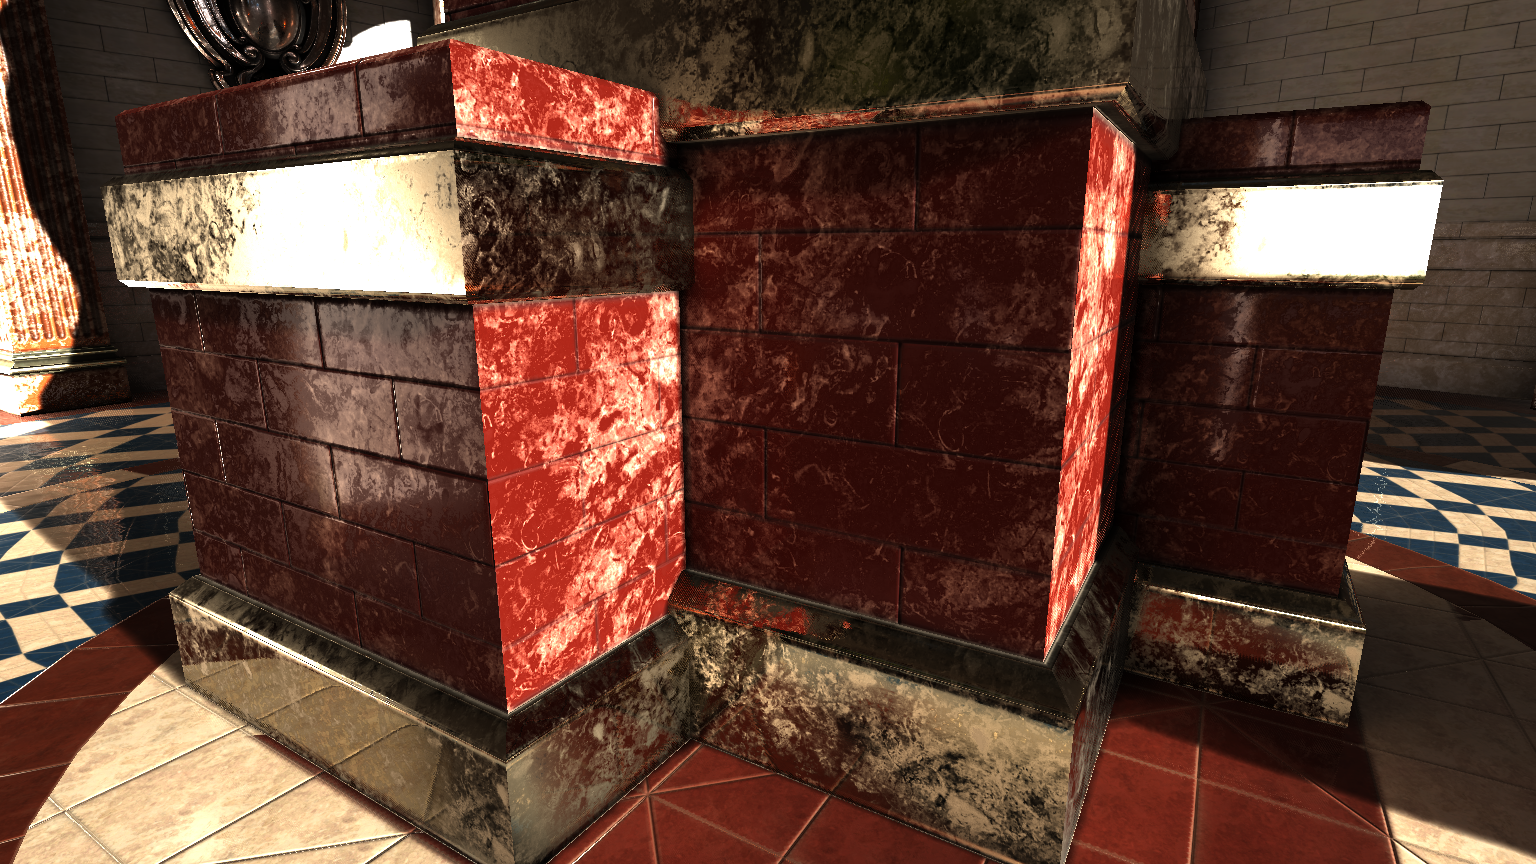
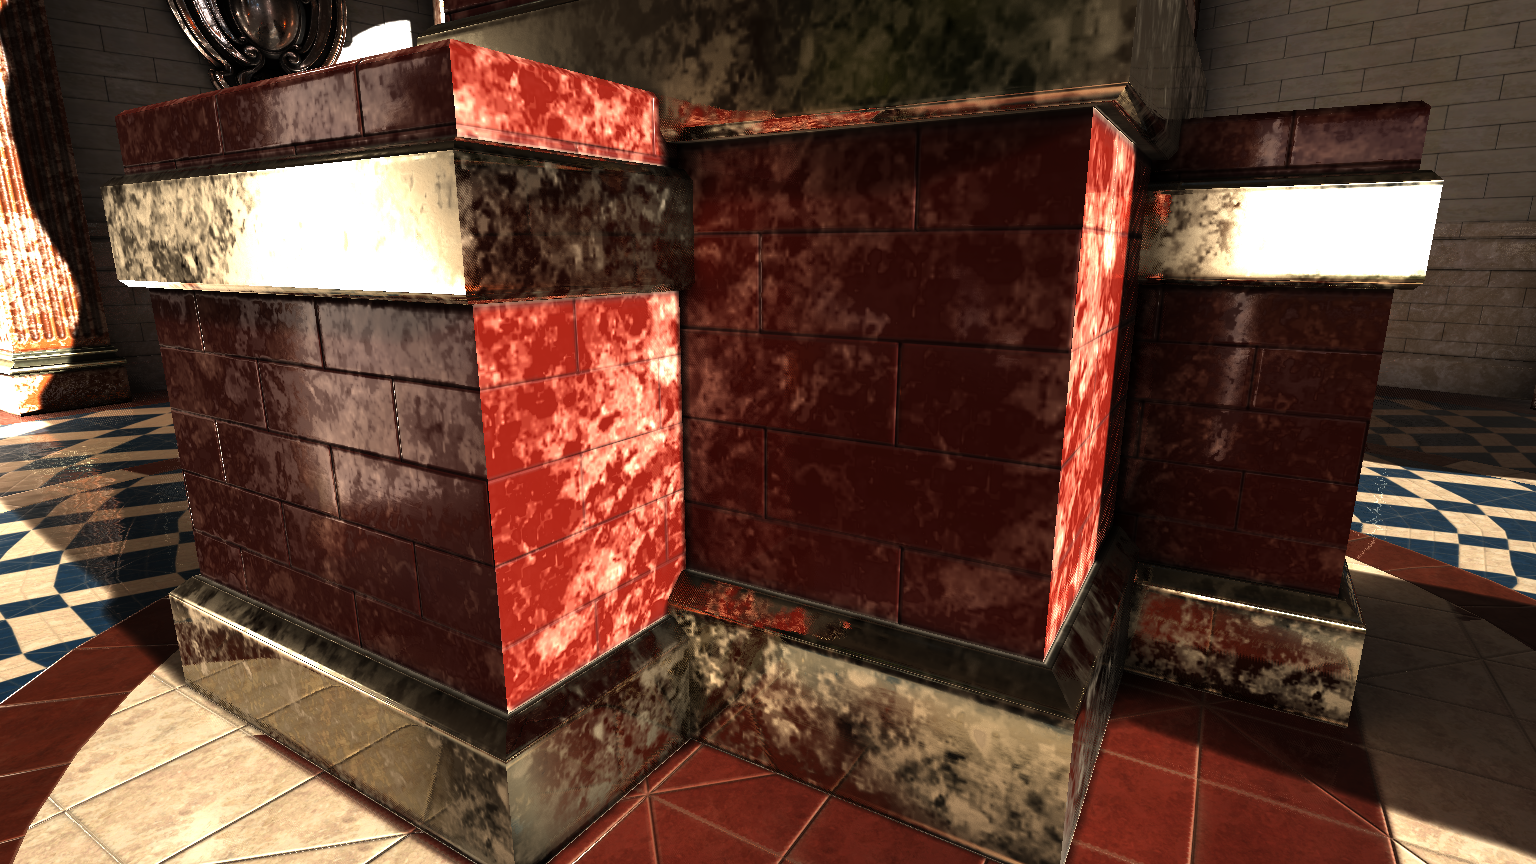
- Compare the original and the resulting textures:
Original:
Result:
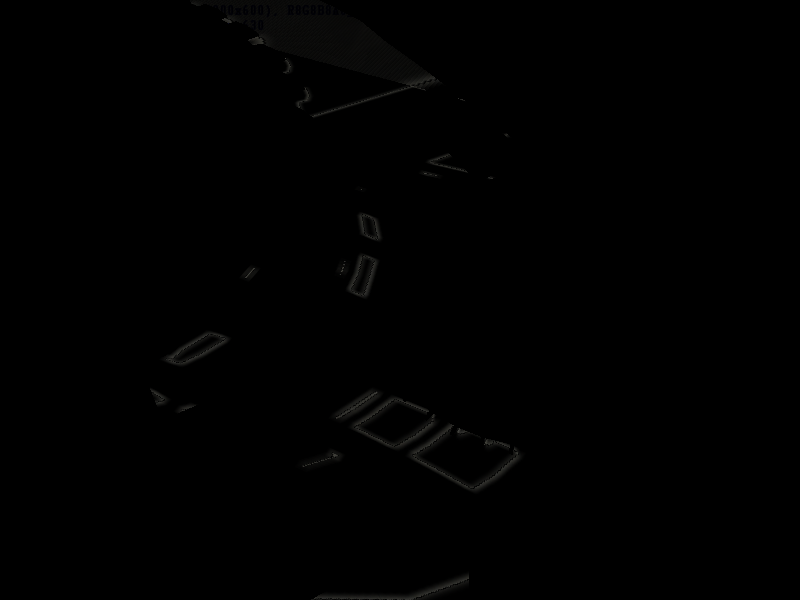
Difference:
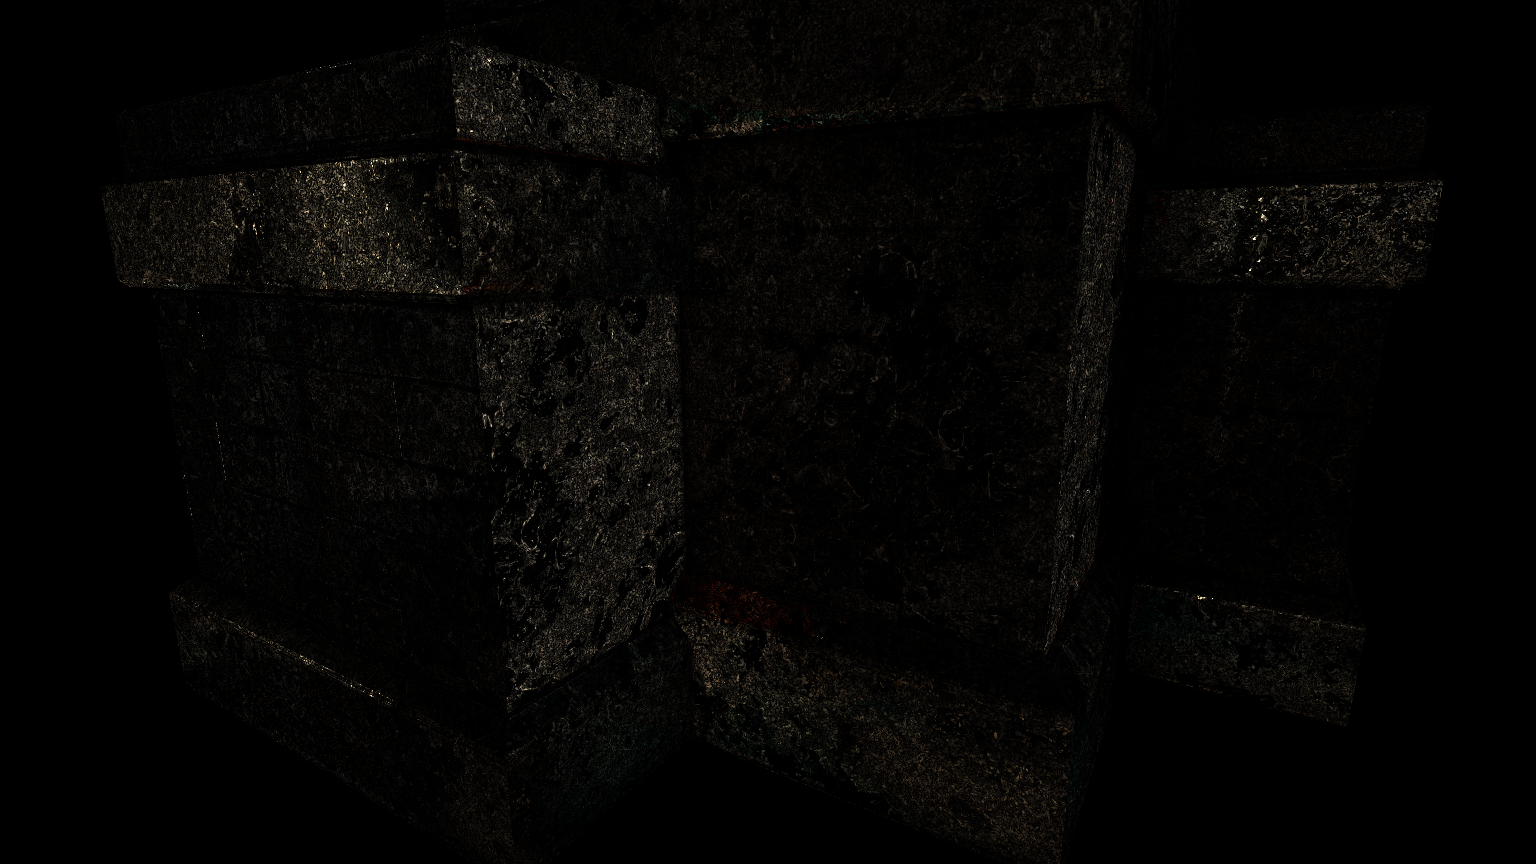
The textures before and after changing the size look quite similar, but the Sampler metric in the 3D Pipeline tab is now green. The execution time is improved by 18% for selection segments and by 4% overall.
Change Filter Parameters in Pixel Shader
Percentage-Closer Filtering (PCF) may often affect the graphics application performance, that is why the described experiment with changing filter parameters uses the PCF as an example to optimize the Sampler bottleneck.
Percentage-Closer Filtering can be used to render antialiased shadows and soft shadows. For more information on the PCF, see https://docs.microsoft.com/en-us/windows/win32/dxtecharts/cascaded-shadow-maps.
To change filter parameters, do the following:
- Open the event with the discovered Sampler bottleneck in the Graphics Frame Analyzer Resource Viewer by selecting this event on the Main bar chart.
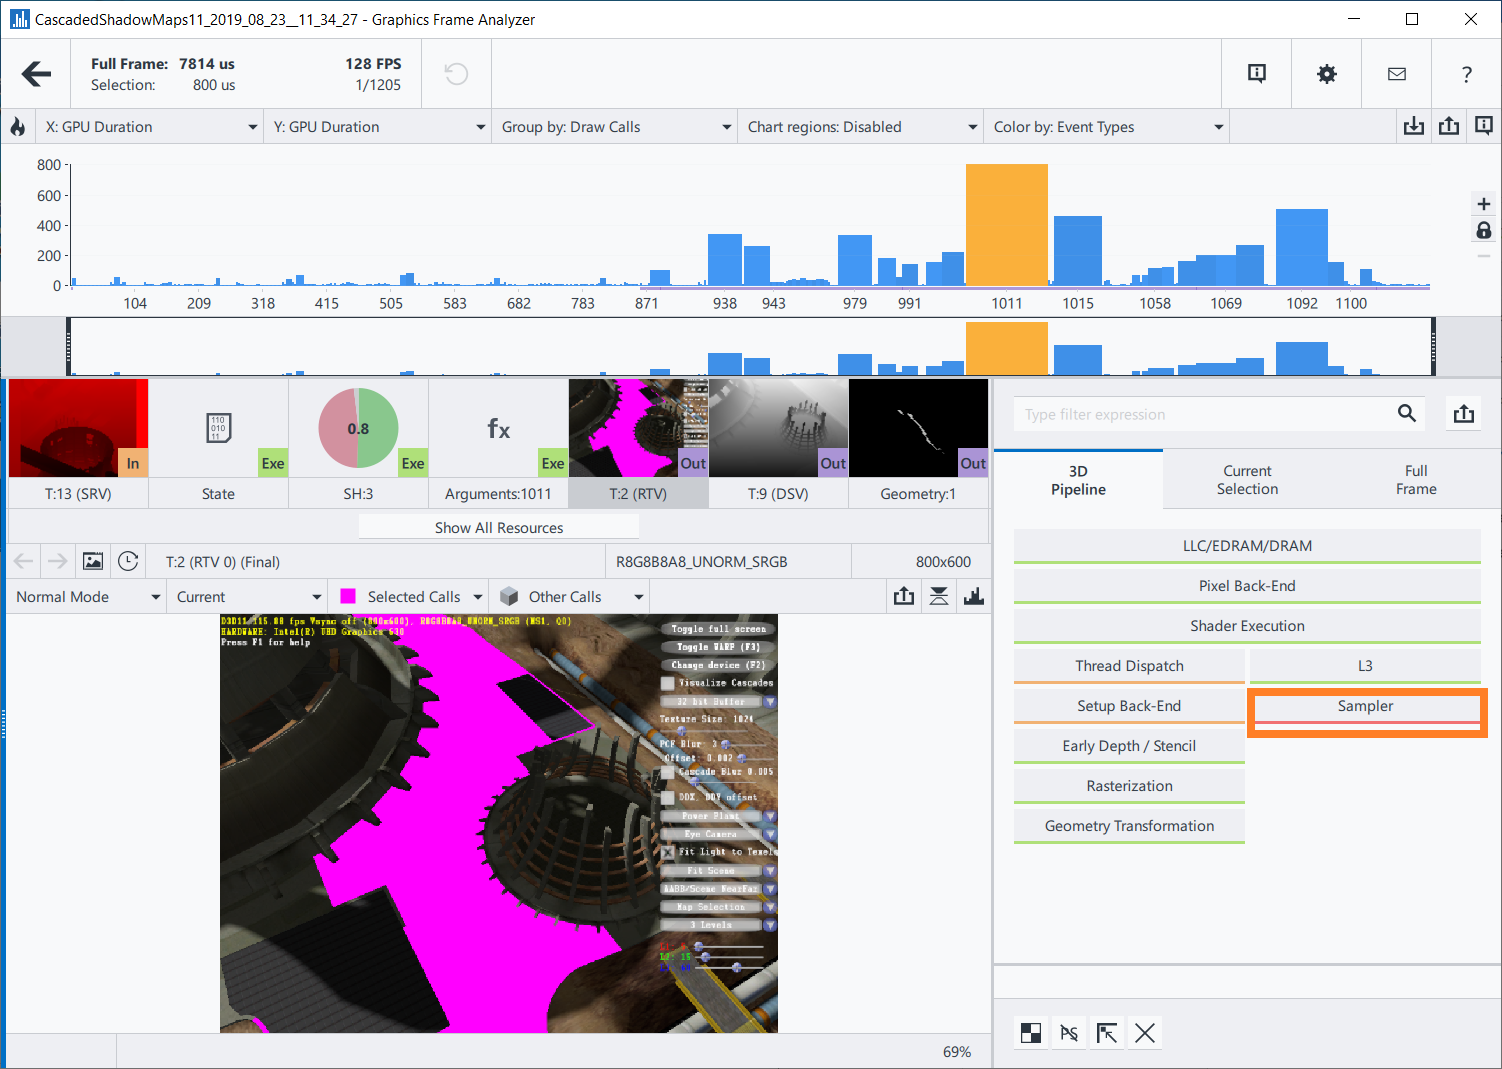
The pink segment contains the texture and shadow rendering. Shadow properties are set in the pixel shader.
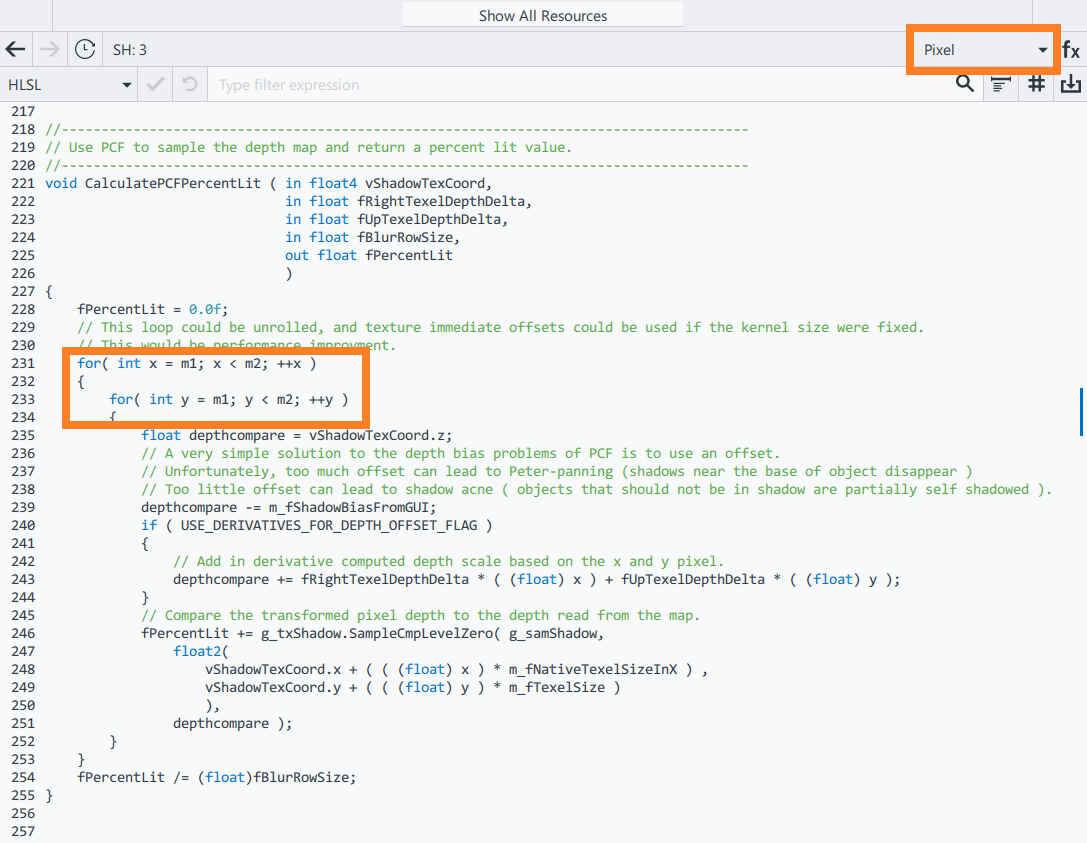
- Select the Shader resource in the Resource List, and then choose the Pixel shader type. The pixel shader contains the CalculatePCFPercentLit method with m1 and m2 values, which represent the iteration range in the filter loop.
m1 and m2 formulas:
m1 = m_iPCFBlurSize / -2
m2 = m_iPCFBlurSize / 2 + 1,
where m_iPCFBlurSize is the kernel size. The initial kernel size is 9, m1 = -4, and m2 = 5.
Reduce the kernel size to 3, set m1 to -1 and m2 to 2.
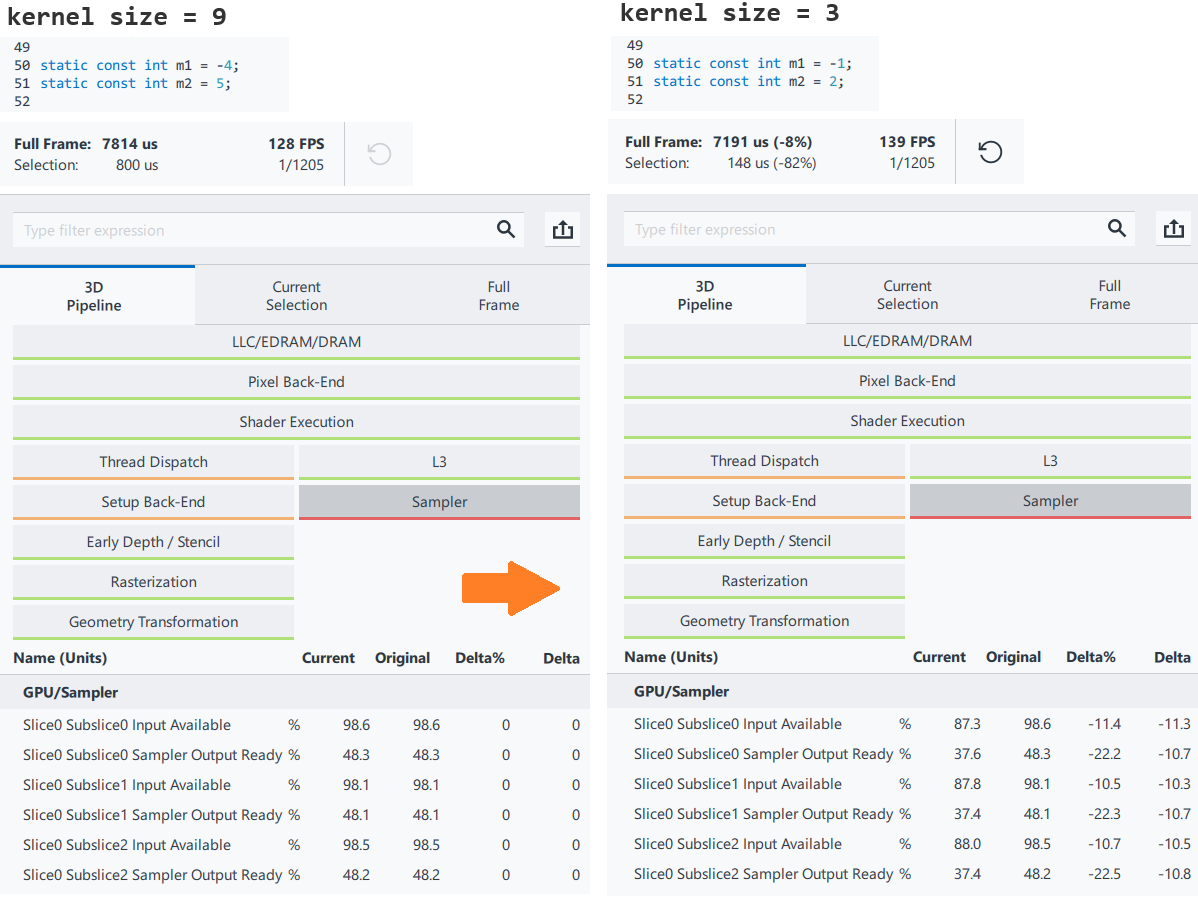
The metrics values are improved, but the Sampler is still a bottleneck.
- Check the extreme condition by setting the kernel size to 1, m1 to 0, and m2 to 1.
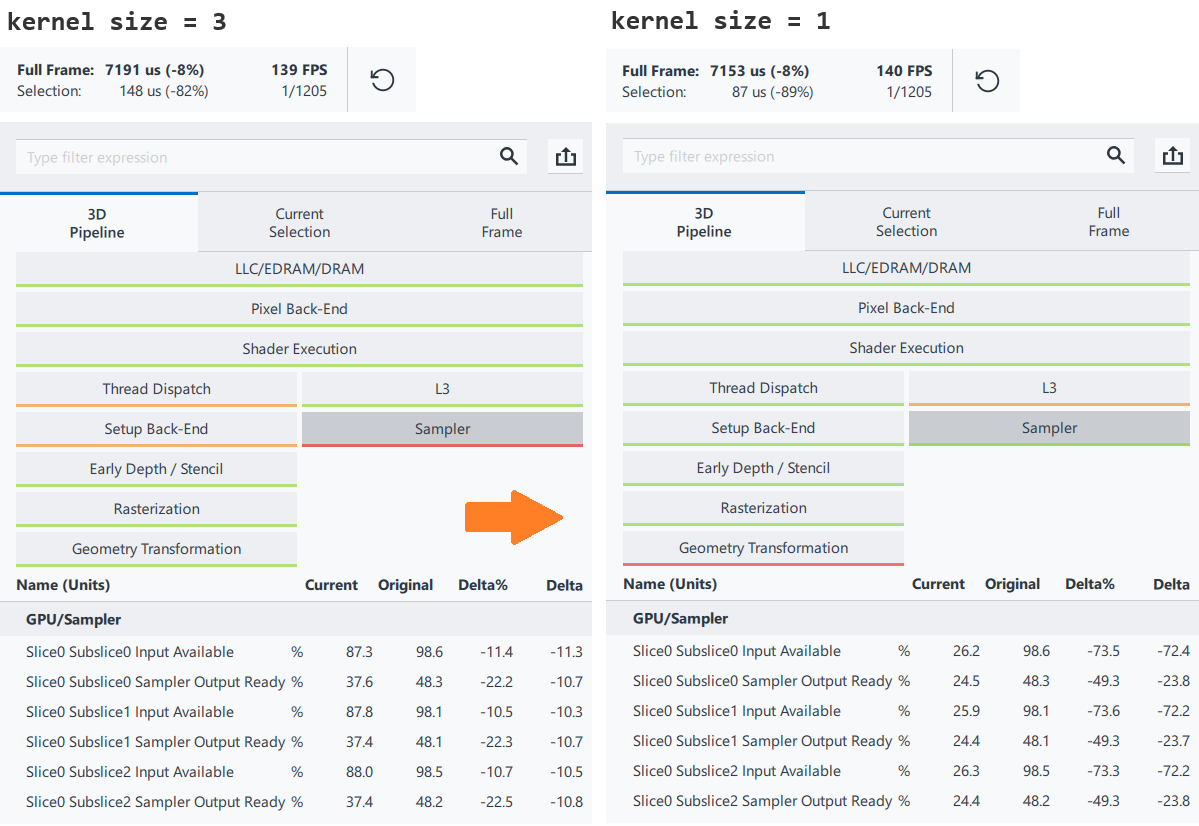
The Sampler is underlined green now. The execution time is improved by 8% overall and by 89% for the selection segment.
Compare the original and the resulting textures:
Original:
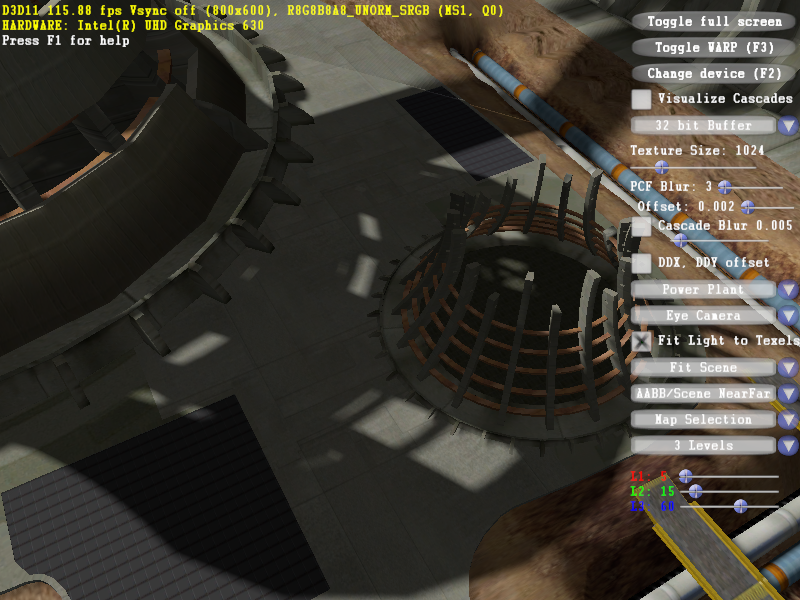
Result:

Difference:
