Get Started with Intel® Distribution for GDB* on Windows* OS Host
Get Started with Intel® Distribution for GDB* on Windows* OS Host
Use this document to start using the Intel® Distribution for GDB* for debugging applications. Follow the instructions below to set up the debugger to debug applications with kernels offloaded to CPU and GPU devices.
Overview
This section is divided into four subsections:
Part Zero: Explanations and prerequisites
Part One: Build and debug a CPU locally
Part Two: Build and debug a CPU remotely (this section builds on Part One)
Part Three: Build and debug a GPU remotely (this section builds on Part Two)
Part Zero: Explanations and prerequisites
It is crucial that you understand that these sections build on each other. For example, if you intend to debug remotely on a GPU, you must first complete Part One and then Part Two before you can start on Part Three.
Intel Distribution for GDB is available as part of the Intel® oneAPI Base Toolkit (Base Kit) or may also be downloaded as standalone component for any other Toolkit installation. For more information on the Base Kit, visit the Developer Toolkits page.
Visit the Release Notes page and FAQ for information about key capabilities, new features, and known issues.
You can use the SYCL* sample, Array Transform, to get started with the Intel Distribution for GDB. The sample does not generate errors and simply illustrates debugger features. The code processes elements of the input array depending on whether they are even or odd, and produces an output array. You can use the sample to debug on either the CPU or GPU.
Prerequisites
Install Microsoft Visual Studio* 2019 or Microsoft Visual Studio* 2022. If you have previously installed Visual Studio, you may have an older version. Consider updating to the latest version for best results.
Install the Intel® oneAPI Base Toolkit for Windows* OS. To free up disk space, you can remove older versions of the Base Kit.
NOTE:Support for Visual Studio* 2017 was removed starting with the Intel® oneAPI 2022.2 release.Resizable BAR or Smart Access Memory must be enabled for debugging applications using Intel® Arc™ A-Series Graphics. Follow the instructions to enable the Resizable BAR. For local GPU debugging, the Resizable BAR needs to be enabled on the local host machine and for remote GPU debugging, this needs to be enabled on the remote target machine.
For local GPU debugging, a Windows system with a combination of either an integrated and a discrete GPU, or multiple discrete GPUs is required. The list of supported GPU devices can be found in Supported Target Hardware Platforms.
For remote GPU debugging, two Windows systems are required: a local host and a remote target. Visual Studio and the Base Kit must be installed on the local host system. The application is deployed and run on the remote target system. Install the latest GPU drivers and configure your remote target system to use them.
To enable Fortran debugging, also install the Fortran Compiler from the Intel® HPC Toolkit for Windows* OS.
Understanding the difference between local and remote debugging
As an option, you can add a discrete Intel® ARC graphics card to a remote target Windows computer and debug applications on the GPU of the remote target system (see graphic below). Be aware that debugging the kernel offloaded to a GPU device halts the GPU device on which the kernel is running, and freezes the display. There are three debugging scenarios:
Debug an OpenCL application kernel/kernels on a CPU on your local host CPU.
Debug a SYCL application kernel/kernels on a remote target GPU.
You can also debug SYCL applications on a local host GPU if there are two dGPUs on the local host system or the local host system has a combination of iGPU (integrated graphics) and dGPU (discrete graphics).
To implement the second scenario, the remote target system must have a GPU that is configured to have the following:

Part One: Build and debug a CPU locally
Build the Array Transform sample (SYCL application)
If you intend to debug a SYCL application, we recommend you start with the Array Transform sample.
In Microsoft Visual Studio, go to File > New > Browse Intel oneAPI Samples and select Debugger: Array Transform, and click OK. You may need to click Continue with code to get to the sample. As a first time note, make sure you have correctly configured your environment. If your environment variables are not set correctly, this step will fail.
If you have already fetched the sample or you have your own sample, simply open the solution file with Microsoft Visual Studio.
In the Solution Explorer, right-click the array-transform project and select Properties. Alternatively, press Alt+Enter or from the Project menu, select Properties.

In the array-transform Property Pages, under Configuration Properties, select General and set Platform Toolset to Intel® oneAPI DPC++ Compiler 2025.

Select DPC++ > General and change Debug Information Format to Program Database for Edit And Continue (/Zi).

Go to the DPC++ > Optimization tab and change Set Optimization to Disabled (/Od).
NOTE:Leave Enable/Disable DPC++ early optimization before generation of SPRI-V code as Default.
Select Linker and set the Pass additional options to device compilers field to /Od. This setting disables kernel optimizations to provide a smooth debug experience.

Click Apply to save the changes. Click Ok. The array-transform Property Changes window closes.
To build the solution, in the main Visual Studio toolbar, select Build > Build Solution . In the Output window, verify that the build is successful.

Go to the Debug menu and select Start without Debugging (Ctrl-F5). The application running in the new console window displays progress. A successful execution looks like the following example:

For more information, refer to Running Intel® GDB Debugger Health Check.
Debug the CPU locally
The best way to start debugging is to debug on the CPU.
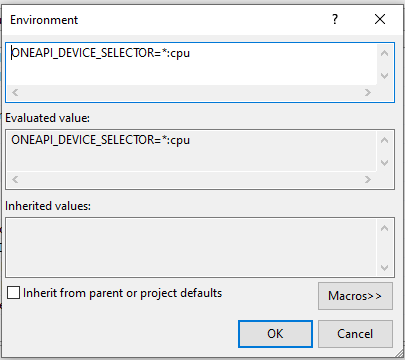
Set an environment variable to run the application kernel/kernels on a CPU. Go to array-transform Properties > Debugging > Environment and enter ONEAPI_DEVICE_SELECTOR=*:cpu.

In the Environment dialog, click Ok. In the array-transform Properties window, click Apply and Ok.
Set a breakpoint at the line marked success in the array-transform.cpp file.
Add another breakpoint on the line with the comment //breakpoint-here.
Click the Local Windows Debugger dropdown to start the debugger.

You will see the thread hit the breakpoint in the kernel. This breakpoint is set in the kernel, which is running in an OpenCL instance on your CPU. This is a good way to quickly debug your kernel code locally on your Windows computer. This confirms that you are able to debug in a kernel. For more information, go to Debug an Application on a GPU.
Part Two: Build and debug a CPU remotely
Debug the local host part of an application remotely
For this section, we assume a two-system setup:
local host system, where Visual Studio and oneAPI toolkits are installed;
remote target system, where the application is deployed and run.
Setup the remote target system
Make sure that runtime dependencies on the shared libraries from the Base Kit are available on the remote target system. You can do this by Installing run-time dependencies and selecting Intel® oneAPI DPC++/C++ Compiler Runtime for Windows* from the list of runtime dependencies. For Fortran remote debugging, select Intel® Fortran Compiler Runtime for Windows*.
Click Next to start the installation.
When the installation is complete, click Close to exit the installer.
Install Microsoft Visual Studio remote debugger based on the version of Visual Studio installed on your local host machine. To learn more about Microsoft Visual Studio remote debugger, refer to Microsoft documentation.
Launch the remote debugger. On the remote target system, start the remote debugger by clicking Remote Debugger in the Start menu. If your start menu does not display the Remote Debugger app, use the Search window to find Remote Debugger.

The Remote Debugger window is displayed on the remote target desktop.

Prepare a project for debugging remotely
Follow the steps below to set up the remote debugging session for the Array Transform sample:
If your Debugger is still running from the previous section, stop the debugger.
On the local host in Visual Studio, open Array Transform Properties. You’ll need the Properties window to complete all of the next steps in this section.
For remote debug: under Configuration Properties select Debugging.
From the Debugger to launch drop-down menu, select Remote Windows Debugger.

For Remote Command, specify the path to the deployment directory on the remote target system. For example, C:\deploy\array-transform.exe.

Set the value for Working Directory and Deployment Directory to the path of the deployment directory on the remote target system, i.e., C:\deploy. The directory will be created on the remote target system and the array-transform executable file will be copied to this location.

Update Remote Server Name using the remote debugger name from the remote target system, including the port number. The default port used by the Microsoft Visual Studio 2022 Remote Debugger server is 4026. For this example, we are using Visual Studio 2022 and the remote server is named ATHENA, so the value entered should be ATHENA; the default port is automatically entered. For more information, refer to Remote Debugger Port Assignments.
 NOTE:You can get the Remote Server name from the window that appears on the remote target system when you start the Remote Debugger.
 NOTE:Remote Command, Working Directory, and Deployment Directory fields must point to the same path, which in this case is C:\deploy.NOTE:If you have arguments for the Remote Command, enter them in the Remote Command Arguments field.
Click Apply to set your changes.
Click the Configuration Manager in the upper right corner of the Properties window and mark the Deploy check box.
NOTE:The Deploy check box is disabled until the Deployment Directory is specified.
Close the Property Pages. Click Ok to close the array-transform Property Pages.
Debug the sample with the breakpoint outside the kernel
To verify the remote debugger setup, start the debugging with the breakpoint outside the kernel:
Take the application that has been running on the CPU and have it run on the remote target kernel.
Change the local host identifier.
On the local host system, return to your project and set a breakpoint outside the kernel offloaded to the GPU, for example, at the line marked as success of the array-transform.cpp file.
To start debugging, on the Debug toolbar, click
 Remote Windows Debugger.NOTE:You may be prompted to log in to the remote target system. Be sure that credentials are set for the remote target system.
When the debugger hits the breakpoint, the example Visual Studio output is shown below:

Your application launches on the remote target system. The offloading will happen to the default device or the device specified by ONEAPI_DEVICE_SELECTOR. The example output of the Remote Windows Debugger on the remote target system is shown below:
This output indicates that you set up the remote debugger successfully and the default L0 GPU device was used for offloading.
Quit the debugger by clicking the
 button.
Get Started with Debugging a Kernel on CPU
Configure application to offload on CPU
In the Solution Explorer, right-click the array-transform project and select Properties. Alternatively, press Alt+Enter.
Under Configuration Properties, select Debugging. For the debugger you intend to use (Local Windows Debugger or Remote Windows Debugger), edit the Environment field by changing the value of the ONEAPI_DEVICE_SELECTOR environment variable to *:cpu.
Uncheck Inherit from parent or project defaults.

Click Apply and Ok.
For more details about the device selection, refer to Compiler Environment Variables.
Debug kernel offloaded to CPU locally
You are ready to debug your project.
Set breakpoint at line marked as breakpoint-here in the array-transform.cpp file.
From the Debug menu, select Start Debugging.
Click the Local Windows Debugger menu.
You will see when the thread hits the breakpoint.
Refer to the Debug Examples in Windows to learn more about using Intel Distribution for GDB.
Debug kernel offloaded to CPU remotely
By now, if you tried to set a breakpoint inside the kernel offloaded to CPU and used the Remote Windows Debugger, the breakpoint was not hit. The reason is that the kernel’s .PDB file is located on the remote machine and Visual Studio cannot find it. To fix that, make the following changes to the settings described in Debug the local host part of an application remotely :
On the remote target system make the directory %USERPROFILE%\AppData\Local\Temp accessible by Visual Studio, such that it could load kernel debug symbols.
On the remote target system, go to %USERPROFILE%\AppData\Local\Temp and open its properties.
Go to the Sharing tab and click Share. A new window pops up. By default, the sharing is configured for the current user.
Click the Share button on the bottom of the window to share the folder for the selected users.
Copy the network path of the shared folder.
Check that the folder is accessible on your local host system by its network path.

In the example above, replace ATHENA with your local host computer name and replace doug with your user name.
When the folder is available, on the local host machine in Visual Studio, go to Tools > Options > Debugging > Symbols. Click a plus-icon to add a new location, from where Visual Studio loads debug symbols, and type the network path of the shared folder there.
Click Browse and navigate to localtemp on your local host. Create the SymbolCache directory in your : %USERPROFILE%\AppData\Local\Temp\SymbolCache:

With the above setting, the breakpoint inside the kernel offloaded to a CPU device should be hit with the Remote Windows Debugger.
Part Three: Build and debug a GPU remotely
Debugging a kernel on a GPU
High-level steps review (Remote will run on a GPU)
This assumes that you’ve already completed the steps in Part Two, i.e., built and debugged on a CPU remotely, and now you are ready to switch to the GPU. Here are the steps that you must have completed from the previous section:
Choose between local and remote debugging and hit a breakpoint outside of the kernel.
Set Up Intel Distribution for GDB with enhanced GPU offload.
Start the debugging session, which deploys and runs the application on the remote target system.
NOTE:If you get a message that looks like the example below, you probably forgot to start the Remote Debugger on the remote target.
Investigate the program state using standard Visual Studio debugging user interface. Additionally, Intel Distribution for GDB provides the oneAPI GPU threads view. More views are provided by Intel Distribution for GDB at Debug an Application on a GPU.
Choose between local and remote debugging
Debugging the kernel offloaded to a GPU device halts the GPU device on which the kernel is offloaded. If the display is also using the same GPU, it will be frozen. When you have multiple GPUs on your system, you can debug locally. Typically, one GPU (often an integrated one) is dedicated to displaying, while the remaining GPUs can be utilized for computation and debugging if they are supported by the debugger. In that case you can use the local debugger.
If your remote target system, where you plan to run the application offloading to a GPU, has just one GPU device and this GPU is supported by the debugger, you can debug the kernel only with the remote debugger. The high-level setup of the remote system is illustrated below:
Before you proceed, check that you can hit a breakpoint outside of the kernel with the chosen debugger:
Configure the remote target system
For debugging kernels offloaded to GPU, Intel Distribution for GDB target installer (gen_debugger_target.msi) has to be installed on the machine, where the application will run.
Copy the target installer of Intel Distribution for GDB (gen_debugger_target.msi) from the local host system to the remote target. The installer, by default, is located on the local host machine at %ProgramFiles(x86)%\Intel\oneAPI\debugger\latest\opt\debugger\target.
Run the installer on local host for local debugging or on the remote target for remote debugging. While installing, select the checkbox under “Additional Installer Task” to set the TdrDelay to the default value of 300 seconds.
Then, in the installer dialog, click the option Add TdrDelay Registry Key and click Next.
 NOTE:The installer sets the following registry keys to 300 seconds:
HKEY_LOCAL_MACHINE\SYSTEM\CurrentControlSet\Control\GraphicsDrivers\TdrDelay
This setting specifies the number of seconds that the GPU can delay the preempt request from the GPU scheduler. This is effectively the timeout threshold.
Without this setting, the debugger will not work properly. The stop at a breakpoint triggers the timeout detection and recovery (TDR) mechanism on Windows, which we need to delay to investigate the state where the debugger has stopped the kernel.
The OS will not be able to recover automatically if the GPU stops responding while producing a graphics output. Ideally, install the remote debugger only on computing GPUs.
Set Up Intel Distribution for GDB with enhanced GPU offload
Steps for Part Three
In Visual Studio, configure the Intel® Distribution for GDB* extension.
Open Tools > Options > Intel® oneAPI > Intel® Distribution for GDB*.
Set Enable Debugging to True.
Ensure a secure connection to the remote target by setting Enable SSH SSL Tunnel to True. Failing to do so may result in insecure communication.
If this option is enabled, you will be asked to enter user credentials while connecting to the remote target system. You can also change the Maximum Number of Retries to control how many times a user can re-enter credentials. To ensure proper functionality, the Windows Remote Management (WinRM) service must be installed and configured on the remote target system. See the Microsoft documentation for more information. It is also required to start the Windows Management Instrumentation (WMI) and DCOM Server Process Launcher service on the remote target system. This can be done from the Windows Services application.
NOTE:Security of the SSH configuration defines security of your system. See the NIST SSH guidelines on setting a strong password.If you installed oneAPI tools in a different location, you need to enter the Base Kit install directory that was chosen during installation. Leave this field blank if the Base Kit was installed in the default location.
Set TCP/IP port to the port number used when running gdbserver-ze. The default is 1234.
 NOTE:The TCP/IP port must differ from the port number used by Microsoft Visual Studio remote debugger.
Click OK to save the changes.
Configure and debug the application
The further setup procedure depends on whether you want to debug a program following SYCL or OpenMP™ standards. For remote debugging, configure your systems as described in the following sections:
Prepare to debug a SYCL kernel on a GPU
If not yet done, configure and build the application.
Go to Project Property pages and under Configuration Properties select Debugging.
From the Debugger to launch drop-down menu, select the debugger you wish to use: Local Windows* Debugger or Remote Windows* Debugger.
Edit the Environment field ONEAPI_DEVICE_SELECTOR=level_zero:gpu. Add the environment variable ZET_ENABLE_PROGRAM_DEBUGGING and set its value to 1.
NOTE:When there are multiple GPUs on the remote target machine you are debugging, you need to find the device number of the GPU using the command sycl-ls in the command prompt of the remote target. Since debugging is supported only on Intel® Arc™ Series GPUs, make sure you select the device number associated with these discrete GPUs.
Once you have identified the device number, you will have to specify this in the Environment field such that the value of the ONEAPI_DEVICE_SELECTOR environment variable is set to level_zero:<device_number>.


Click OK. Click Apply and OK.
Run the Remote Debugger (this will run GDB).
Prepare to debug an OpenMP kernel on a GPU
To debug an OpenMP project, set environment variables as follows:
Set device type to GPU:
LIBOMPTARGET_DEVICETYPE=GPU
Choose level0 as an offload target:
LIBOMPTARGET_PLUGIN=level0
Configure flags for the backend compiler.
For level0:
LIBOMPTARGET_LEVEL0_COMPILATION_OPTIONS=-g -cl-opt-disable
(Optional) Print offload profile information at the end of offload:
LIBOMPTARGET_PROFILE=T
(Optional) Print OpenMP library debug traces:
LIBOMPTARGET_DEBUG=1
Set the environment variable to enable program debugging:
ZET_ENABLE_PROGRAM_DEBUGGING=1

To prepare a project for debugging, do the following:
Create a new SYCL Console App project.
Set Property Pages > General > Platform Toolset to Intel(R) oneAPI DPC++ Compiler 2025. Click Apply.
Set Property Pages > Debugging > Environment as shown above.
Set Property Pages > DPC++ > Language > OpenMP Support to Generate Parallel Code (/Qiopenmp).
Set Property Pages > DPC++ > Language > Enable OpenMP Offloading to Generate x86 + SPIR64 fat binary (/Qopenmp-targets:spir64).
Add your code and compile the application.
To prepare a Fortran project for debugging, do the following:
Make sure you have installed:
on the local host system, the Fortran Compiler from the Intel® HPC Toolkit for Windows* OS.
on the remote target system, the Intel® Fortran Compiler Runtime for Windows* from the Intel® oneAPI standalone component installation files.
Create a new Fortran project.
Set Property Pages > General > Use Compiler to IFX Intel(R) Fortran Compiler. Press Apply.
Set Property Pages > Debugging > Environment as shown above.
Set Property Pages > Fortran > Code Generation > Enable OpenMP Offloading to Generate x86 + SPIR64 fat binary (/Qopenmp-targets:spir64).
Set Property Pages > Fortran > Language > Process OpenMP Directives to Generate Parallel Code (/Qopenmp).
Set Property Pages > Fortran > Language > OpenMP Support to Generate Parallel Code (/Qiopenmp).
Add your code and compile the application.
Copy your executable to the deployment directory on your remote target system.
Under Property Pages select Debugging.
From the Connection drop-down menu, select Remote with Windows authentication
Update Remote Server Name using the remote debugger name from the remote target system, including the port number. The default port used by the Microsoft Visual Studio 2022 Remote Debugger server is 4026.
For Remote Command, specify the path to the deployment directory on the remote target system. For example, C:\deploy\local_vars.exe.

Running Intel® GDB Debugger Health Check
The Intel® GDB Health Check tool determines if the machines and the application are correctly configured to debug the kernel offloaded to CPU and GPU. The icon is located in the toolbar of the Visual Studio.

When debugging locally, the tool verifies if there are compatible GPUs on the machine, the environment variables are set correctly, and the prerequisites are met. If the tool detects any issues, it provides the necessary information in the Error List window.

When debugging remotely, the user needs to run the Health Check script manually on the remote target machine. The tool provides the default path to this script which the user needs to run on the command prompt of the remote target machine.

Build and debug the sample
To build the solution, select Build > Build Solution in the main Visual Studio toolbar. In the Output window, verify that the build is successful.
Now you are ready to debug your project with the kernel offloaded to the GPU. Follow the steps in the Debug an Application on a GPU to start debugging.