Introduction
Intel® Graphics Performance Analyzers (GPA) offers a wide range of tools to analyze graphics applications across diverse workloads, platforms, and graphics APIs. Within Intel® GPA you can use Graphics Frame Analyzer to identify and analyze problem areas in your applications to resolve GPU performance regressions. This article will demonstrate how to use the Bar Chart and API Log while analyzing a single frame in Graphics Frame Analyzer to manipulate data and discover performance bottlenecks within your applications. Topics covered in this article can be visualized in video format in the Working with the Bar Chart and API Log Deep Dive video, by checking reference markers in the images associated with this article.
Pre-requisites
Before proceeding with this article, ensure you have the minimum system requirements to successfully analyze graphics applications using Intel® GPA. Also make sure you have downloaded and installed Intel® GPA on your host platform.
Bar Chart
Configuring the Bar Chart
While a single frame is open in Graphics Frame Analyzer you can visualize the performance of your frame in the Main Bar Chart of the tool. You can choose which quantitative metrics are displayed in this bar chart by selecting from the X (1) and Y (2) axis drop-down menus. The Group By (3) drop-down menu allows you to change how events are grouped. While selecting an option from this menu your bar chart transforms, and as do your API Log. You can group events by the following options:
- Debug Regions: Combines events by debug groups provided by a developer.
- Draw Calls: No grouping occurs.
- Render Targets: Groups events that were combined by bound render targets.
- Command Lists: Groups events that were combined by command lists.
- Pipeline States: Groups events that were combined by bound pipeline state objects.
- Shader Sets: Groups events that were combined by bound shaders.
- Custom Regions: Enables you to group and name regions in the API Log.
NOTE: The Group By, Shader Sets, Command Lists, and Pipeline States only apply to Microsoft* DirectX 12 and Vulkan* frames, whereas DirectX 11 supports grouping by Shader Sets but not Command Lists and Pipeline States.
The Chart Region (4) drop-down menu enables a markup on the top of the main bar chart to highlight the same groups that are available in the Group By drop-down menu.
The Color By (5) drop-down menu allows you to color bars on the main bar chart according to the type of events or bottlenecks.
NOTE: The Color By drop-down menu is only available if your system supports the full list of Intel® performance counters.
You can import saved metric data from a CSV file onto the chart for comparison with the current metric values by pressing the Import (6) button. Similarly, you can export your metrics in CSV format by pressing the Export (7) button.
NOTE: You can only import metric data for the same frame file with the same set of metrics selected.
You can display the color legend used in the Main Bar chart, categorized by the Color by menu to denote events or bottlenecks by pressing the Show Color Legend (8) button. When coloring by Event Types which is any graphics API function that produces GPU activity you can view the different colors for the following calls:
- Draw
- Clear
- Dispatch
- Copy
- Sync
- Render Pass
- Region

Navigation and Zooming
To change the vertical scaling of the bar chart to increase or decrease the relative height of the bars press the + or – buttons respectively. Alternatively, you can hold down the CTRL key on your keyboard and scroll up or down with your mouse wheel to re-scale the bars. You can disable vertical auto-scaling by clicking on the lock 🔒 icon between the + and – buttons. To change the horizontal scaling of the Main Bar chart you can use the Frame Navigation bar by dragging the left or right control boundary.

Hotspot Mode
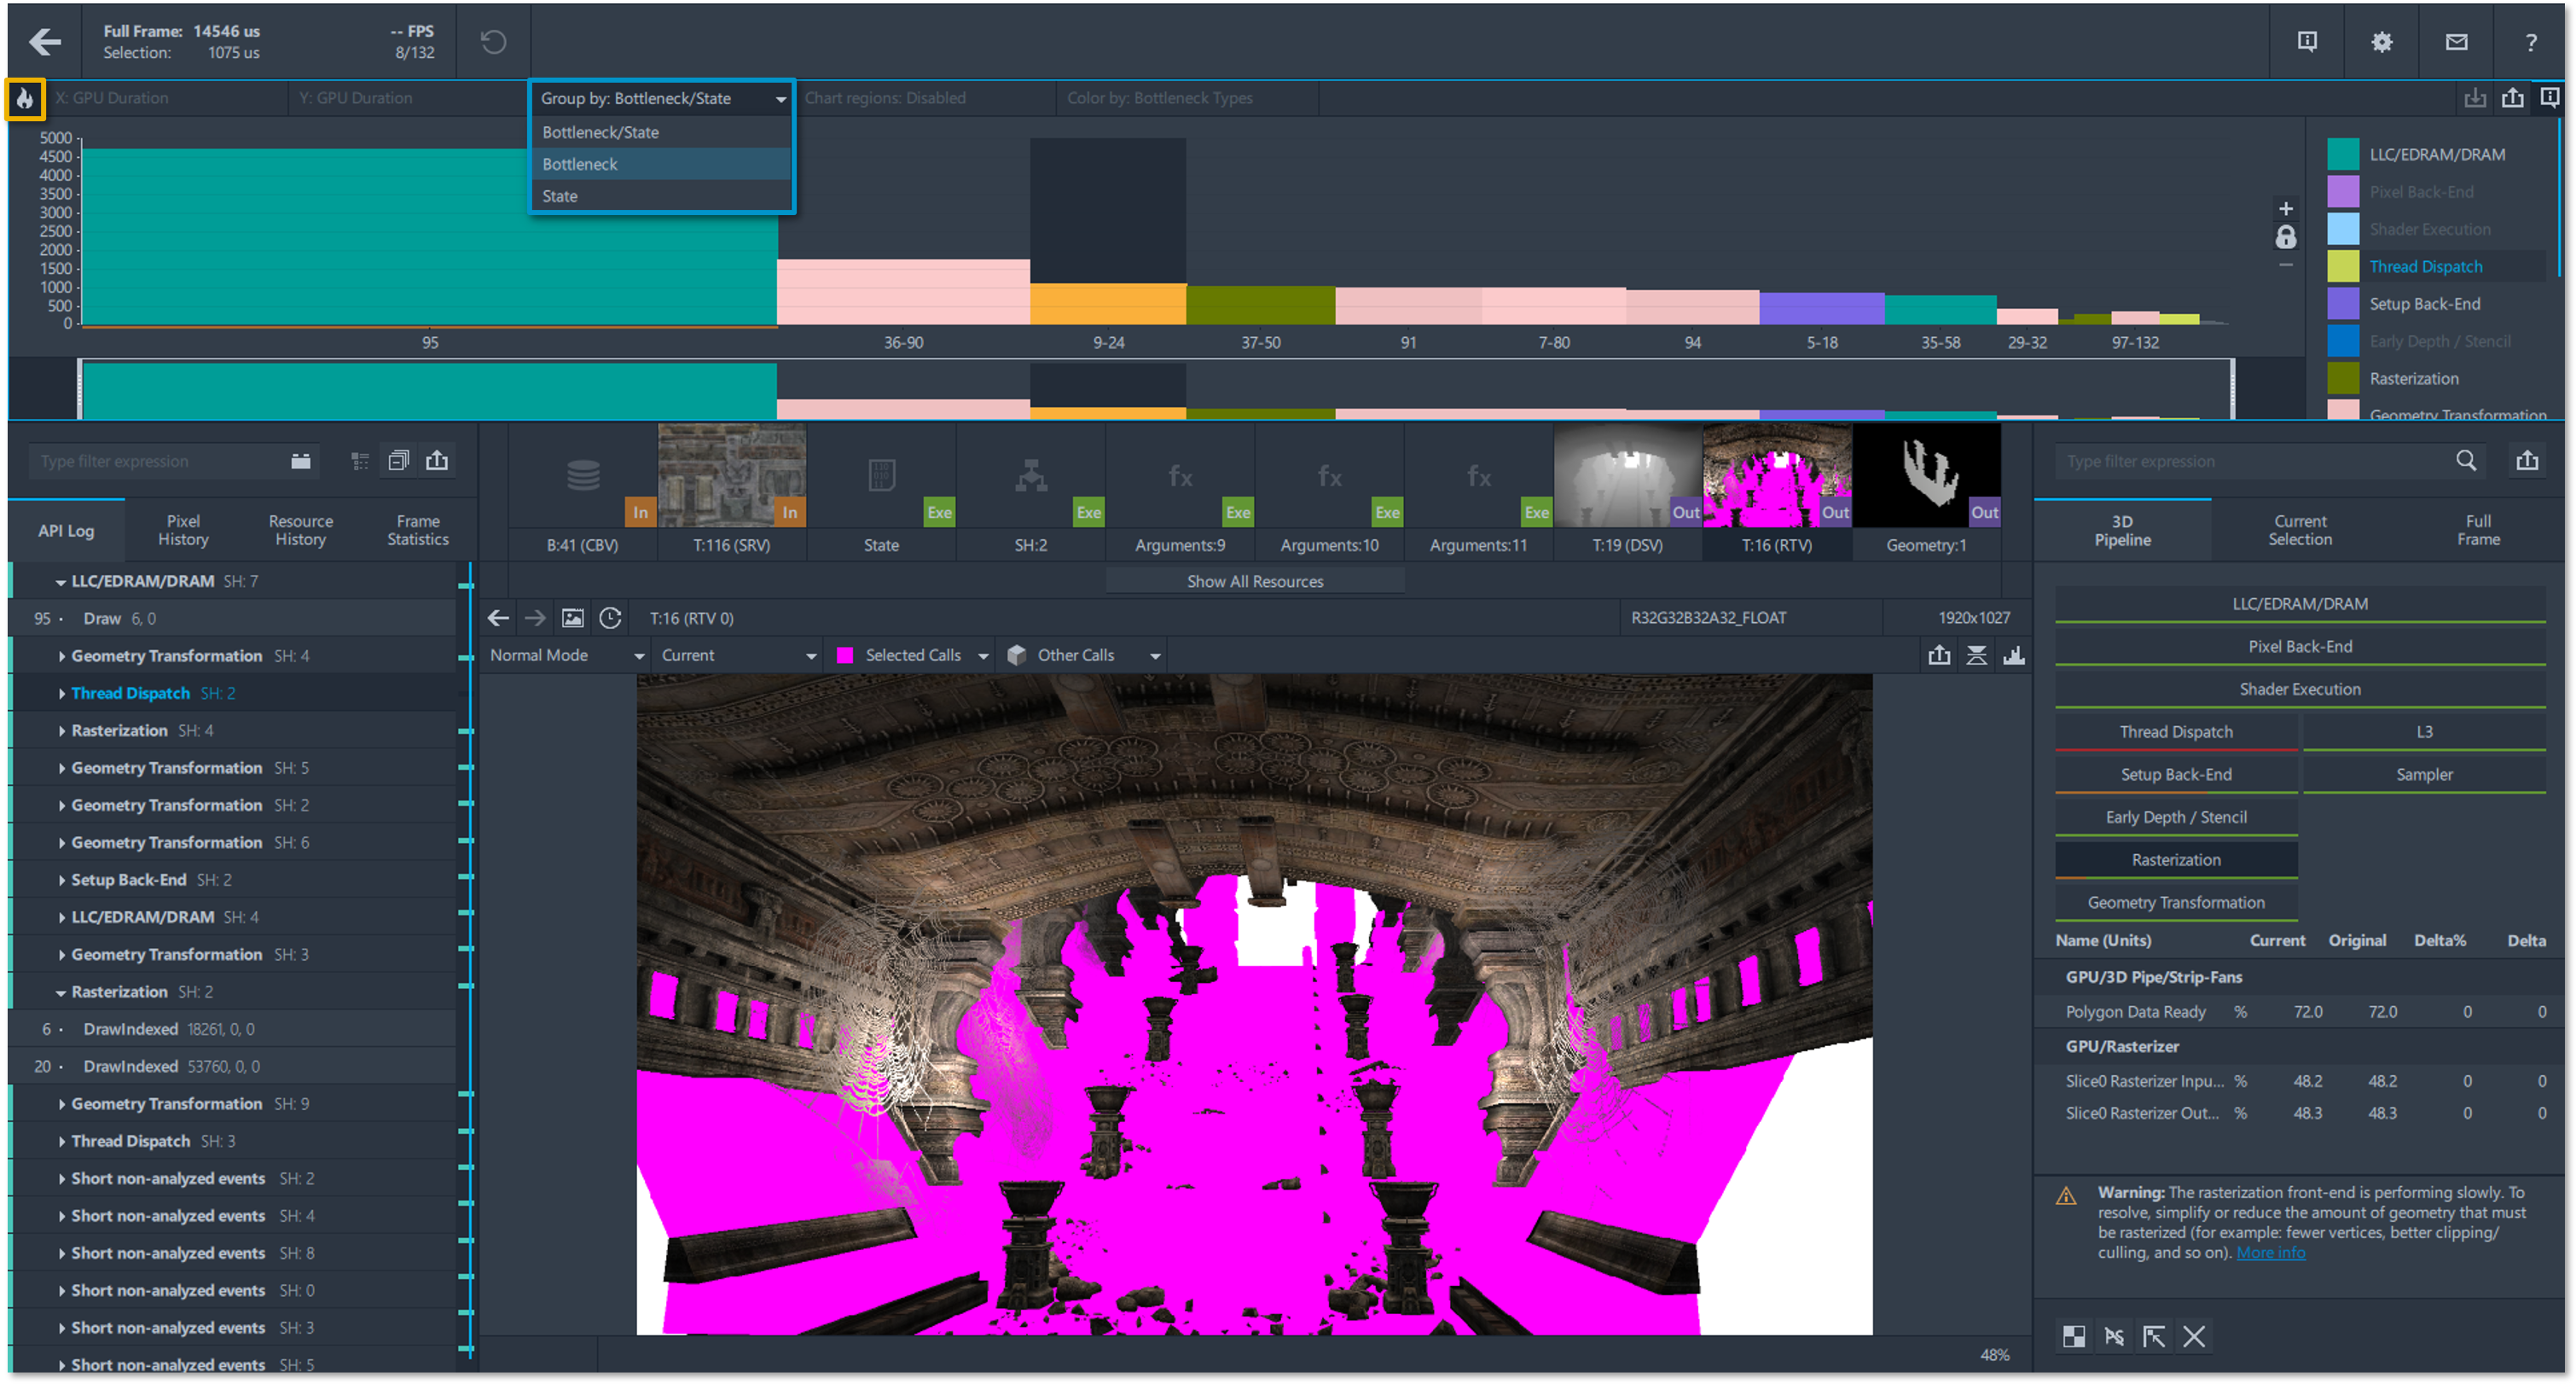
To enable advanced performance analysis of your frame, press the Hotspot Mode button notated by a flame 🔥 icon at the top left of the Visualization Settings toolbar. When Hotspot Mode is enabled the bar chart shows grouped calls with the longest group on the left side of the bar chart. You can view short descriptions of discovered bottlenecks and the state of the pipeline used in the API Log. You can view detailed descriptions of these discovered bottlenecks and potential solutions in the 3D pipeline tab of the metrics pane. In hotspot mode calls can be grouped by the following:
- Bottleneck and State: Calls are simultaneously grouped by two parameters; bottleneck description and pipeline state or shader sets for DirectX 11 applications.
- Bottleneck: Calls are first grouped by bottleneck description then followed by pipeline state.
- State: Calls are first grouped by pipeline state then followed by bottleneck description.
NOTE: If Hotspot Mode is enabled, the Full Frame parameter in the Frame Statistics panel on the top left-hand corner of the tool will show the aggregate durations of events.
API Log
Useful Features
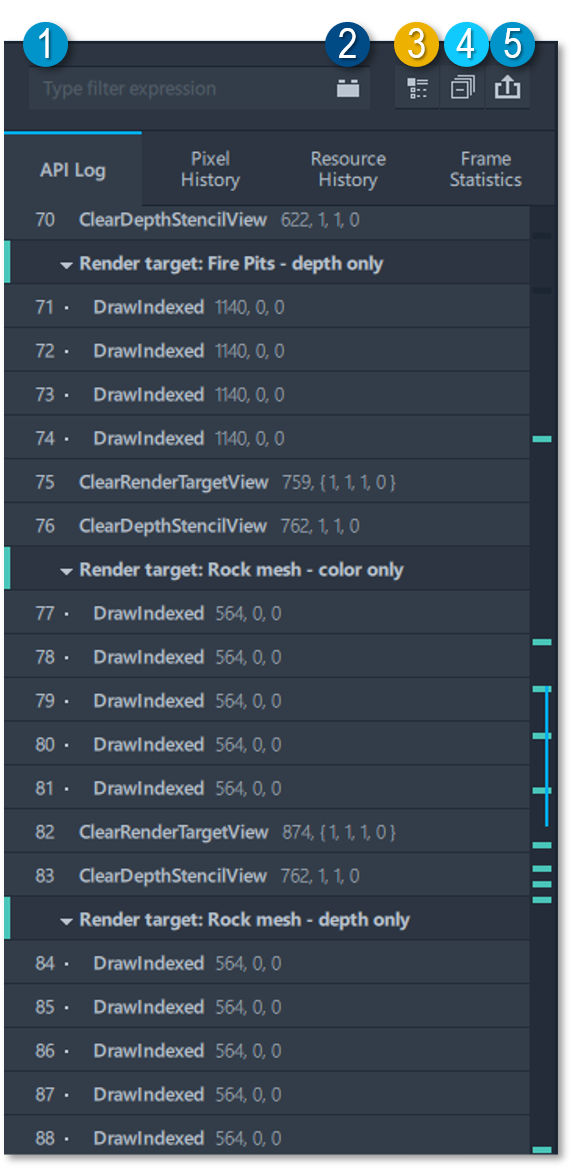
In the API Log panel, you can filter graphics API functions by name or parameters by typing into the Filter Expression (1) field. Pressing the Execute Plugin (2) button next to this field will allow you to select a plugin from a drop-down list of available plugins and then define arguments for your selected plugin to filter through displayed API functions. You can press the Full API Log (3) button to display all functions used in the frame, in the call order. You can press the Collapse All Groups (4) button to close each group in the API Log tab. You can export your API Log into CSV format by pressing the Export API Log (5) button or alternatively by pressing CTRL-S on your keyboard.
Custom Regions
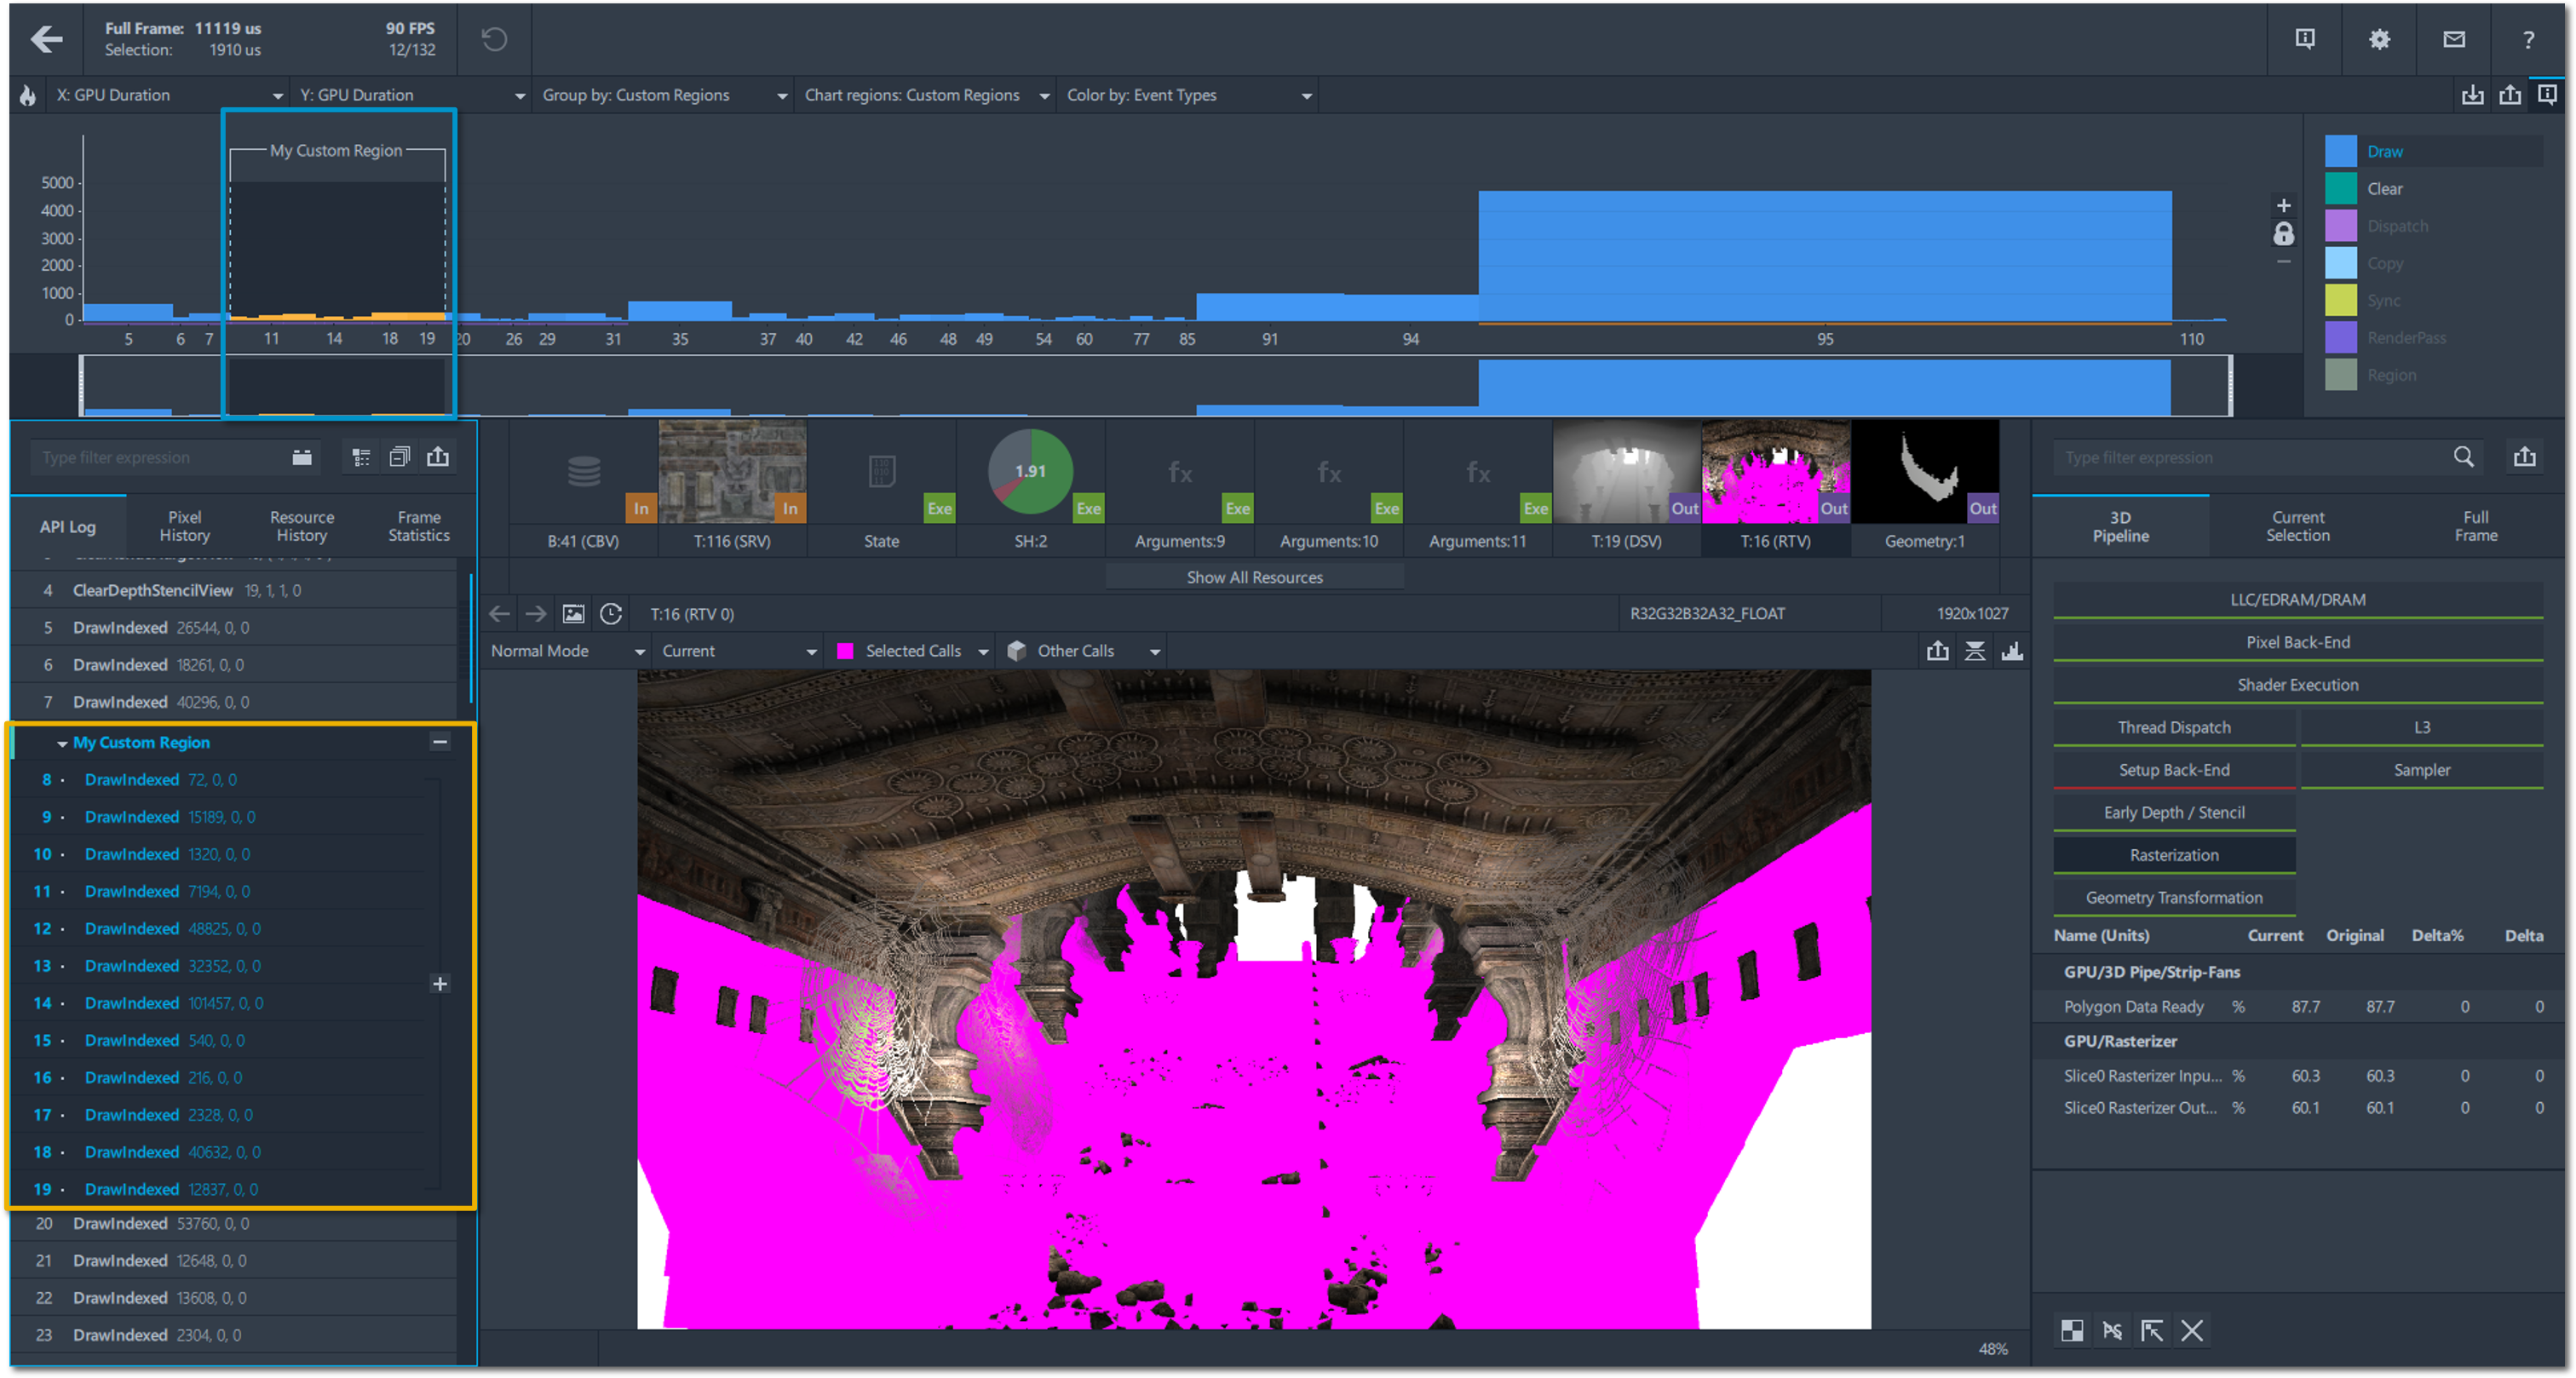
To create custom regions to be displayed in the Main Bar chart you can select the Custom Regions option from the Group By drop-down menu. In the API Log you can select an event or a group of sequential events, then click the + button and enter a name for the created custom region. To delete a custom region simply click on the – button to the right of the regions name and your custom region will be deleted.
Pixel History Tab
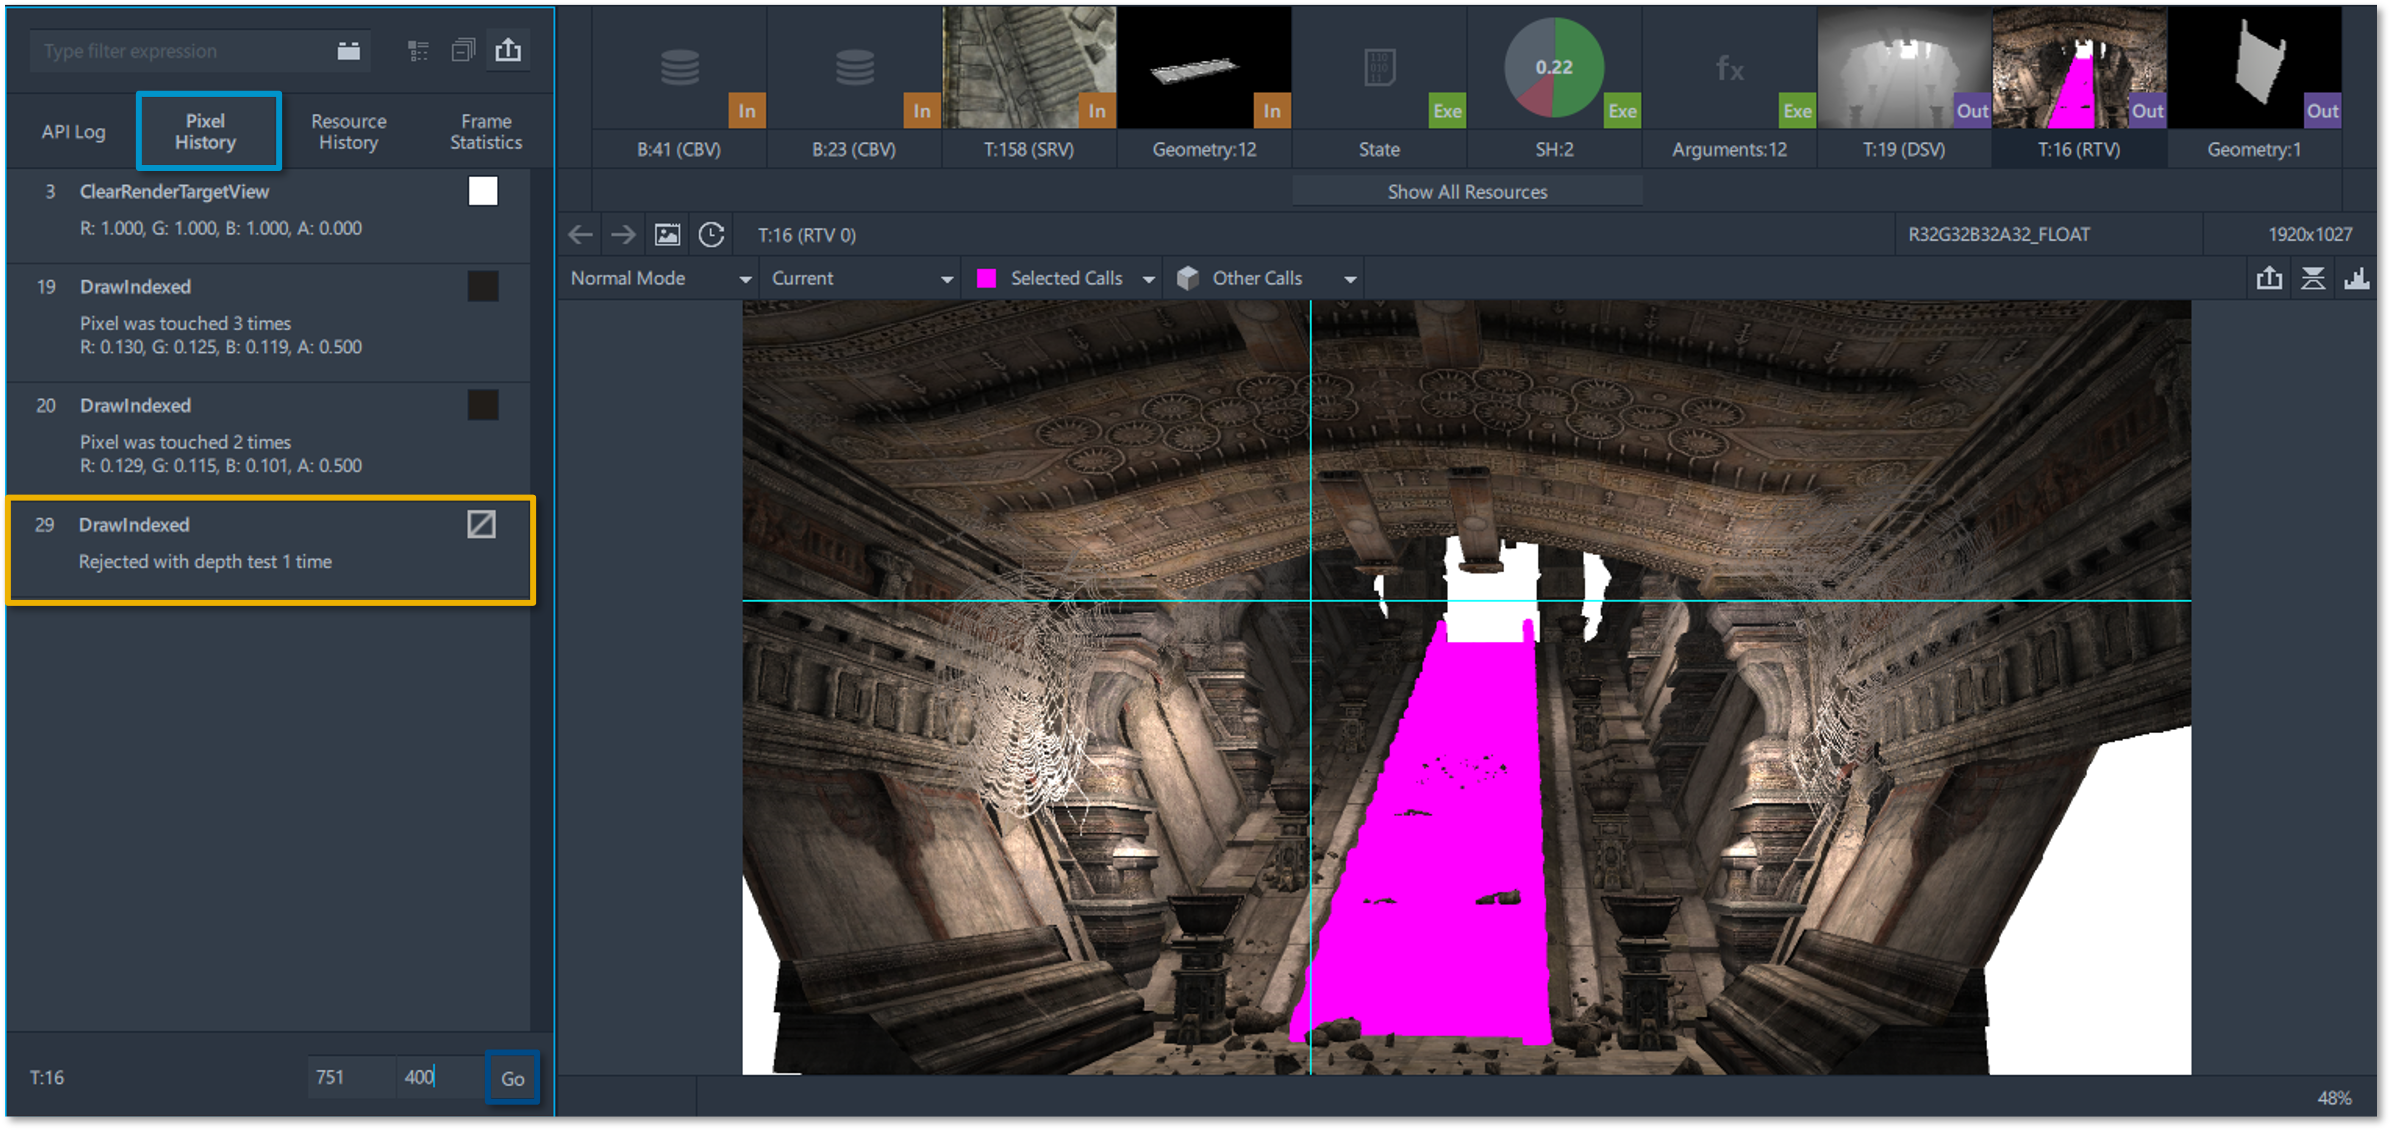
In the API Log panel, there are three other tabs, the first of which being the Pixel History tab. The Pixel History tab shows only the events that contribute to the user specified pixel, that the user selected from the resource viewer. When a pixel is selected, this tab filters API calls to only display events that affected this specific pixel with colored boxes next to each call that displays the color written into the framebuffer after that calls execution. If the call was rejected at one of the pipeline stages, then the box displays a line running diagonally through it. To select a different pixel, you can either select a different pixel from the resource viewer or type in coordinates for that pixel at the bottom of the pixel history then then press the Go button.
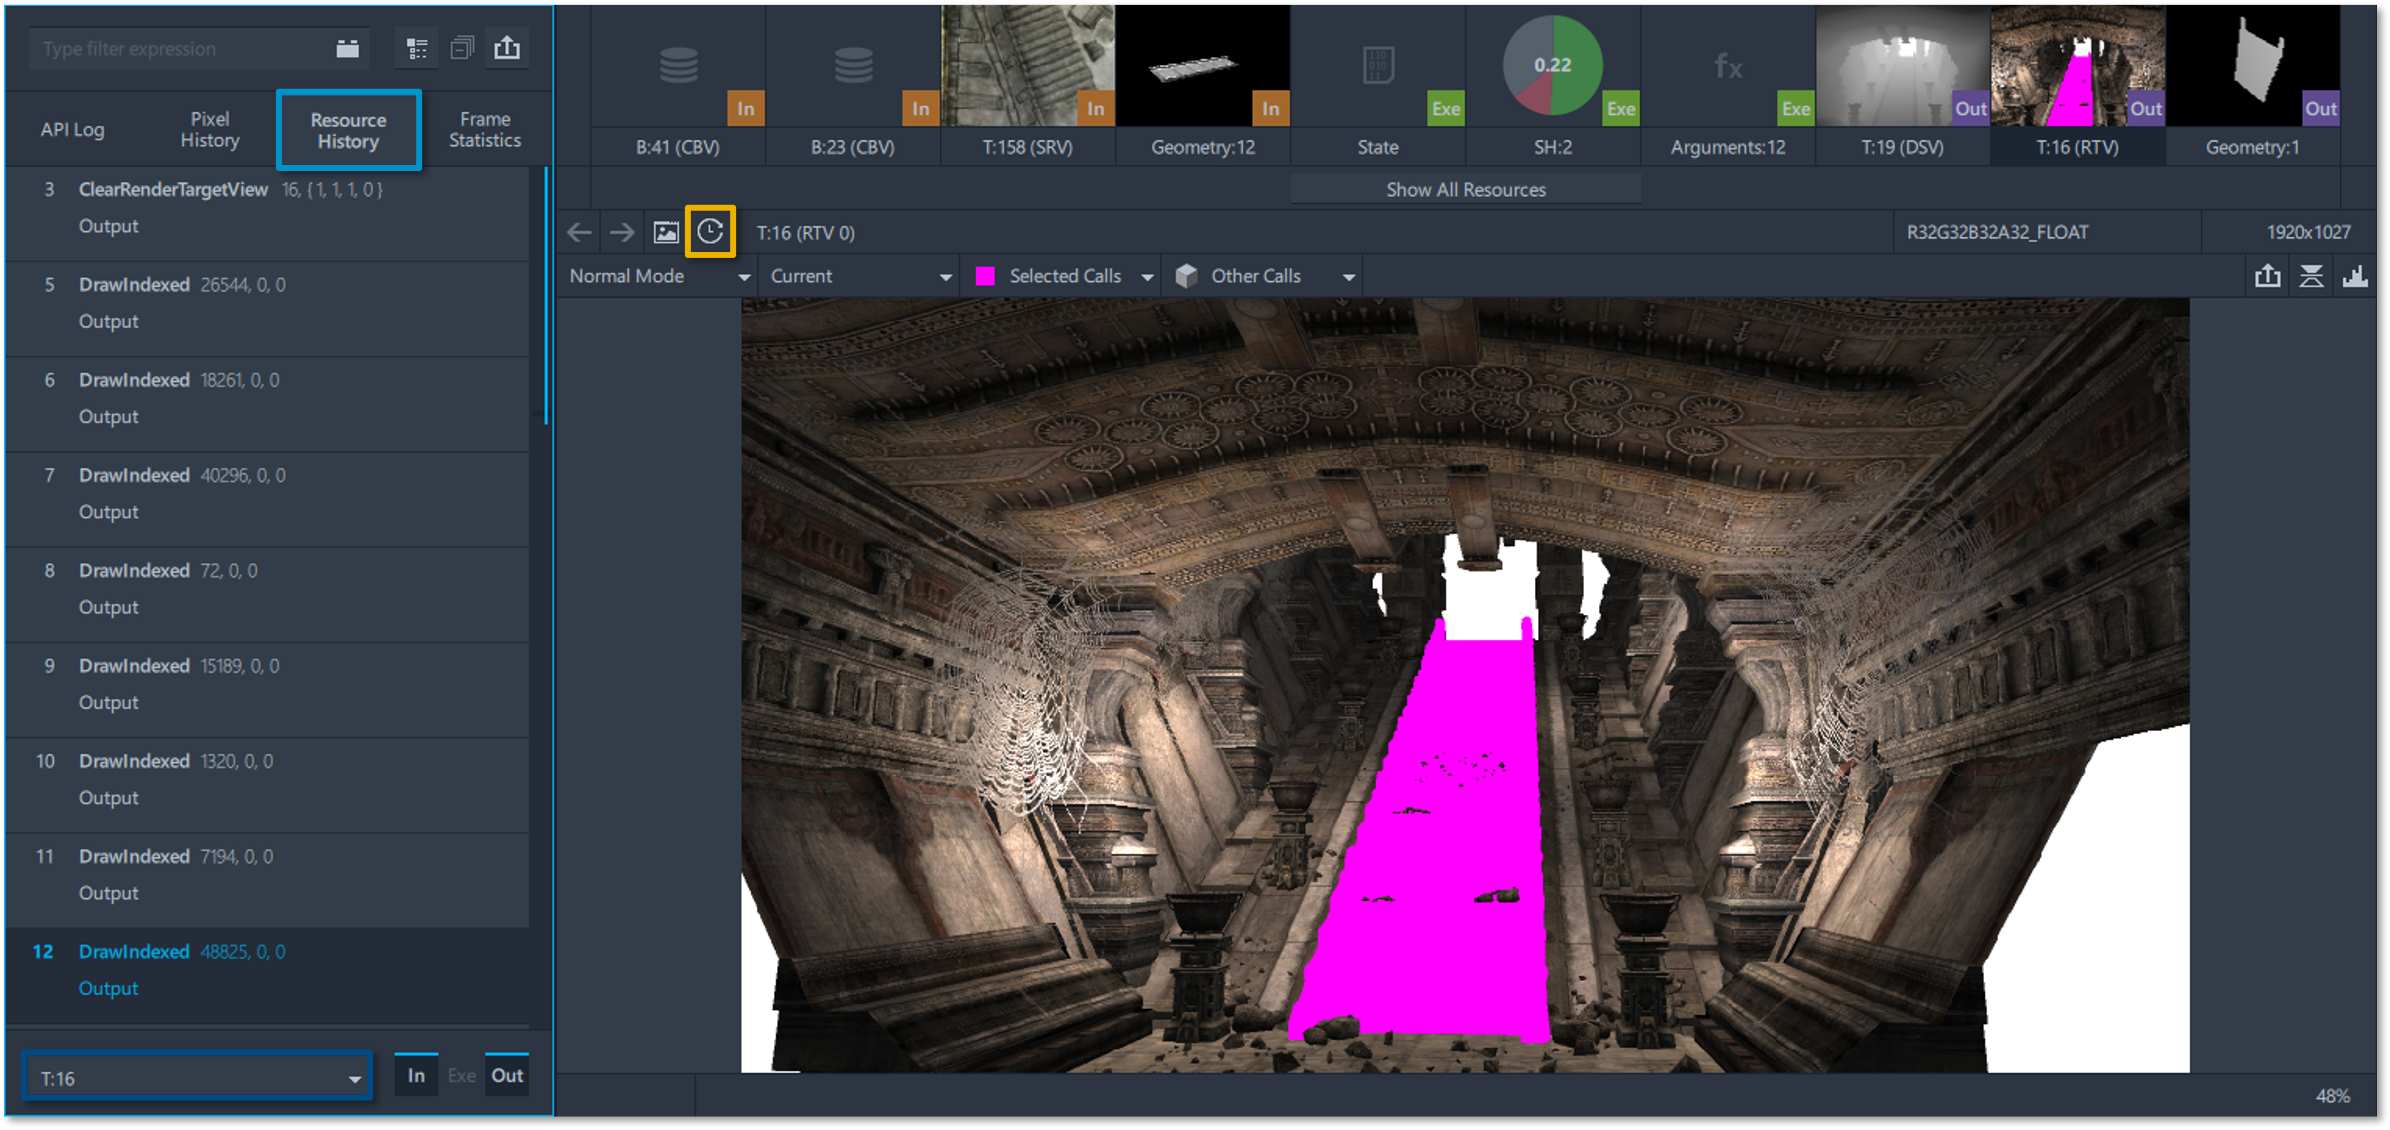
Resource History Tab
The Resource History tab displays only the events that use the user specified resource that the user selected from the resource list and enabled by pressing the Resource History button or double-clicking on any resource in the resource list. You can use the Select Resource drop-down list in the resource history tab to navigate through specific resources as well as view their resource stages.
Frame Statistics Tab
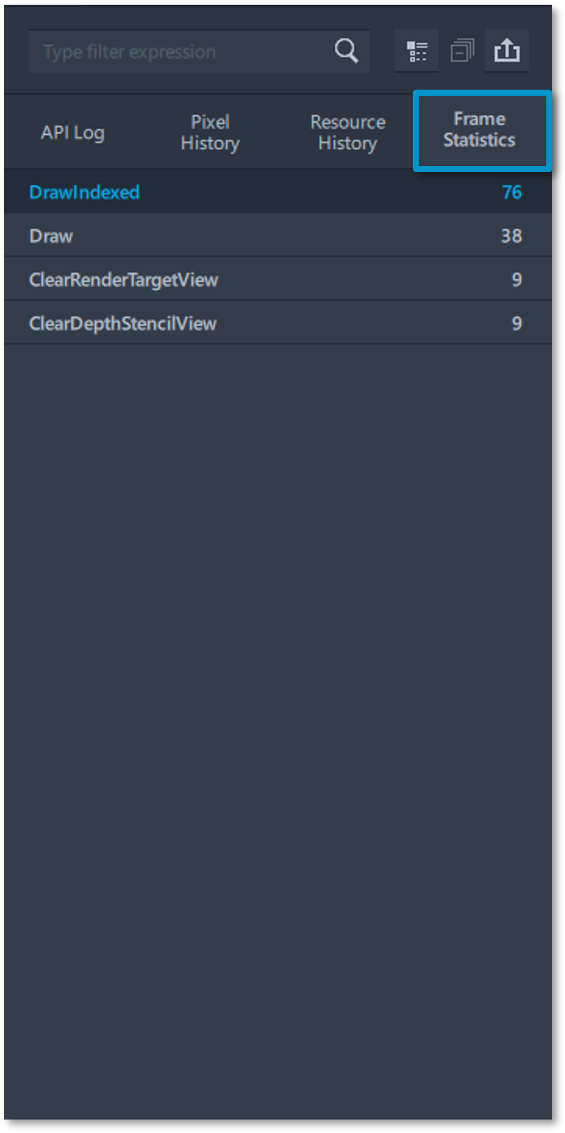
The Frame Statistics tab displays the number of calls of each type in the frame and clicking on each type will select the corresponding calls in the bar chart of the tool.
Conclusion
This article demonstrated how to use the Bar Chart and API Log while analyzing a single frame in Graphics Frame Analyzer. For more information on how to identify and analyze problem areas in your applications to resolve GPU performance regressions continue reading the Graphics Frame Analyzer Deep Dive articles.
Additional Resources
Part 1: Configure and Capture Frames (Article)
Part 2: Configure and Capture Multiple Frames (Article)
Part 3: Open and Explore Multiple Frames (Article)
Part 4: Open and Explore a Single Frame (Article)
Part 5: Working with the Bar Chart and API Log (Video)
Part 6: Exploring the Metrics Viewer (Article)
Part 7: Inspecting a Draw Call (Article)