Introduction
Intel® Graphics Performance Analyzers (GPA) offers a wide range of tools to analyze graphics applications across diverse workloads, platforms, and graphics APIs. Within Intel® GPA you can use Graphics Frame Analyzer to identify and analyze problem areas in your applications to resolve GPU performance regressions. This article will demonstrate how to perform render state experiments while analyzing a single frame in Graphics Frame Analyzer to isolate potential bottlenecks and areas of optimization in your games. Topics covered in this article can be visualized in video format in the Render State Experiments Deep Dive video, by checking reference markers in the images associated with this article.
Pre-requisites
Before proceeding with this article, ensure you have the minimum system requirements to successfully analyze graphics applications using Intel® GPA.Also make sure you have downloaded and installed Intel® GPA on your host platform.
Overview
While in single frame view of Graphics Frame Analyzer, select a draw call from the Bar Cart of the tool and then look at the bottom of the Metrics panel where you can view the four different render state experiments you can apply to your selected call(s), including the following:
- The Two by Two Texture Override experiment
- The Simple Pixel Shader Override experiment
- The One by One Scissor Rect Override experiment
- The Disable Events experiment
Two by Two Texture Override
Applying the Two by Two Texture Override experiment causes all textures for a selected event to be replaced by a simple two by two texture, using a simple halftone or colorized bitmap. If applying this experiment on your specific draw call improves your applications framerate significantly and decreases the GPU duration, this is an indicator that your game may be texture bound and would benefit from optimizing your textures. There are several ways you can optimize your textures including but not limited to the following:
- Reducing the size of your textures.
- Reducing the number of textures used in the scene.
- Reducing the texture filtering setting, specifically minimizing anisotropic filtering.
- Reducing the number of texture fetches in your shaders.
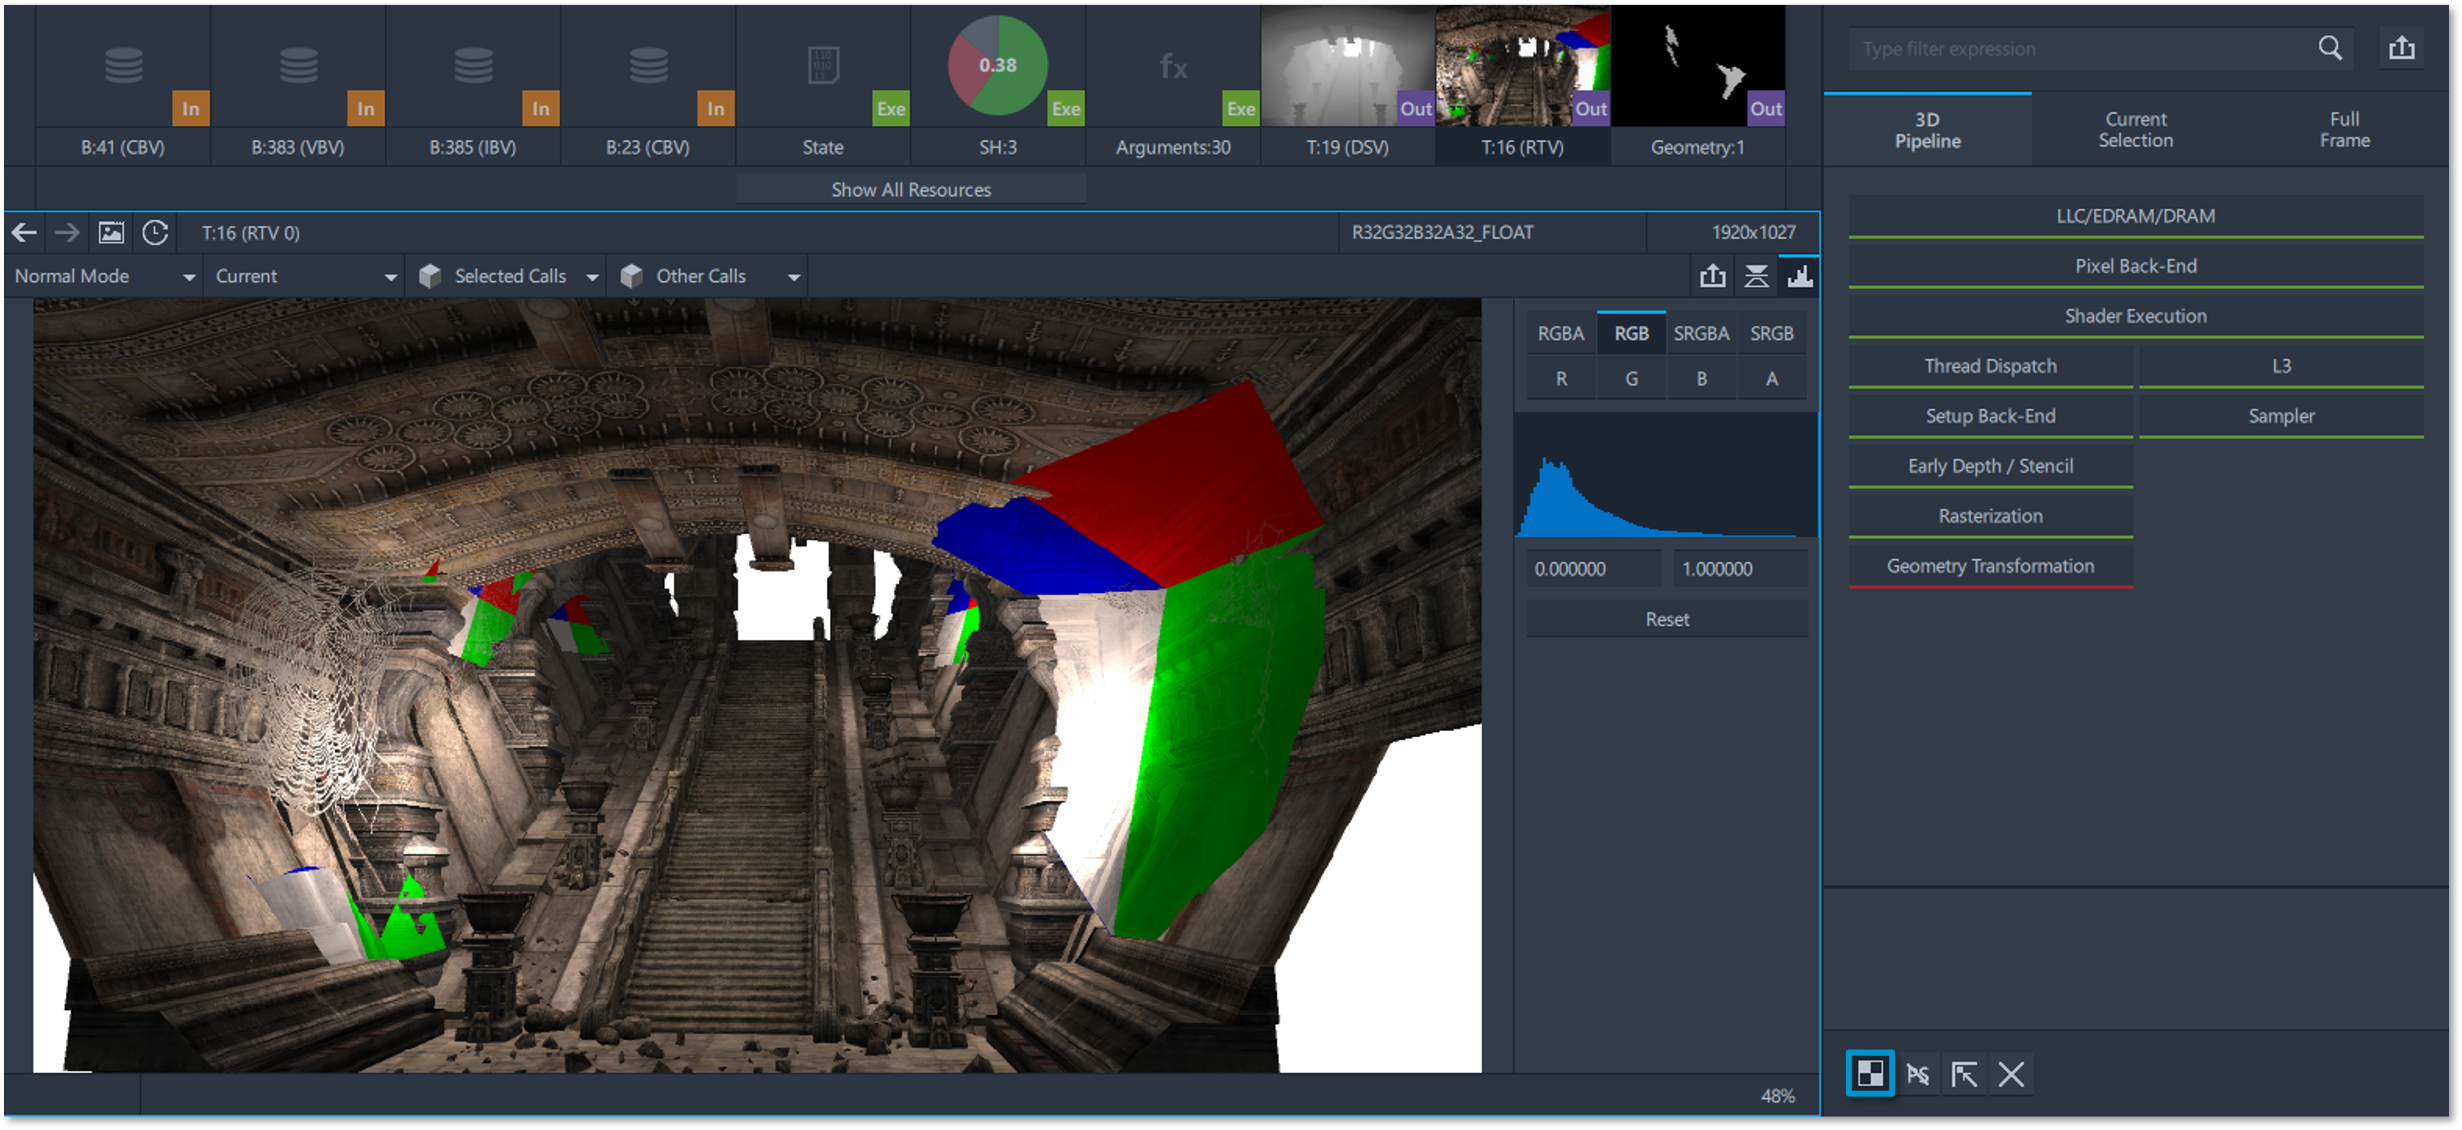
Simple Pixel Shader Override
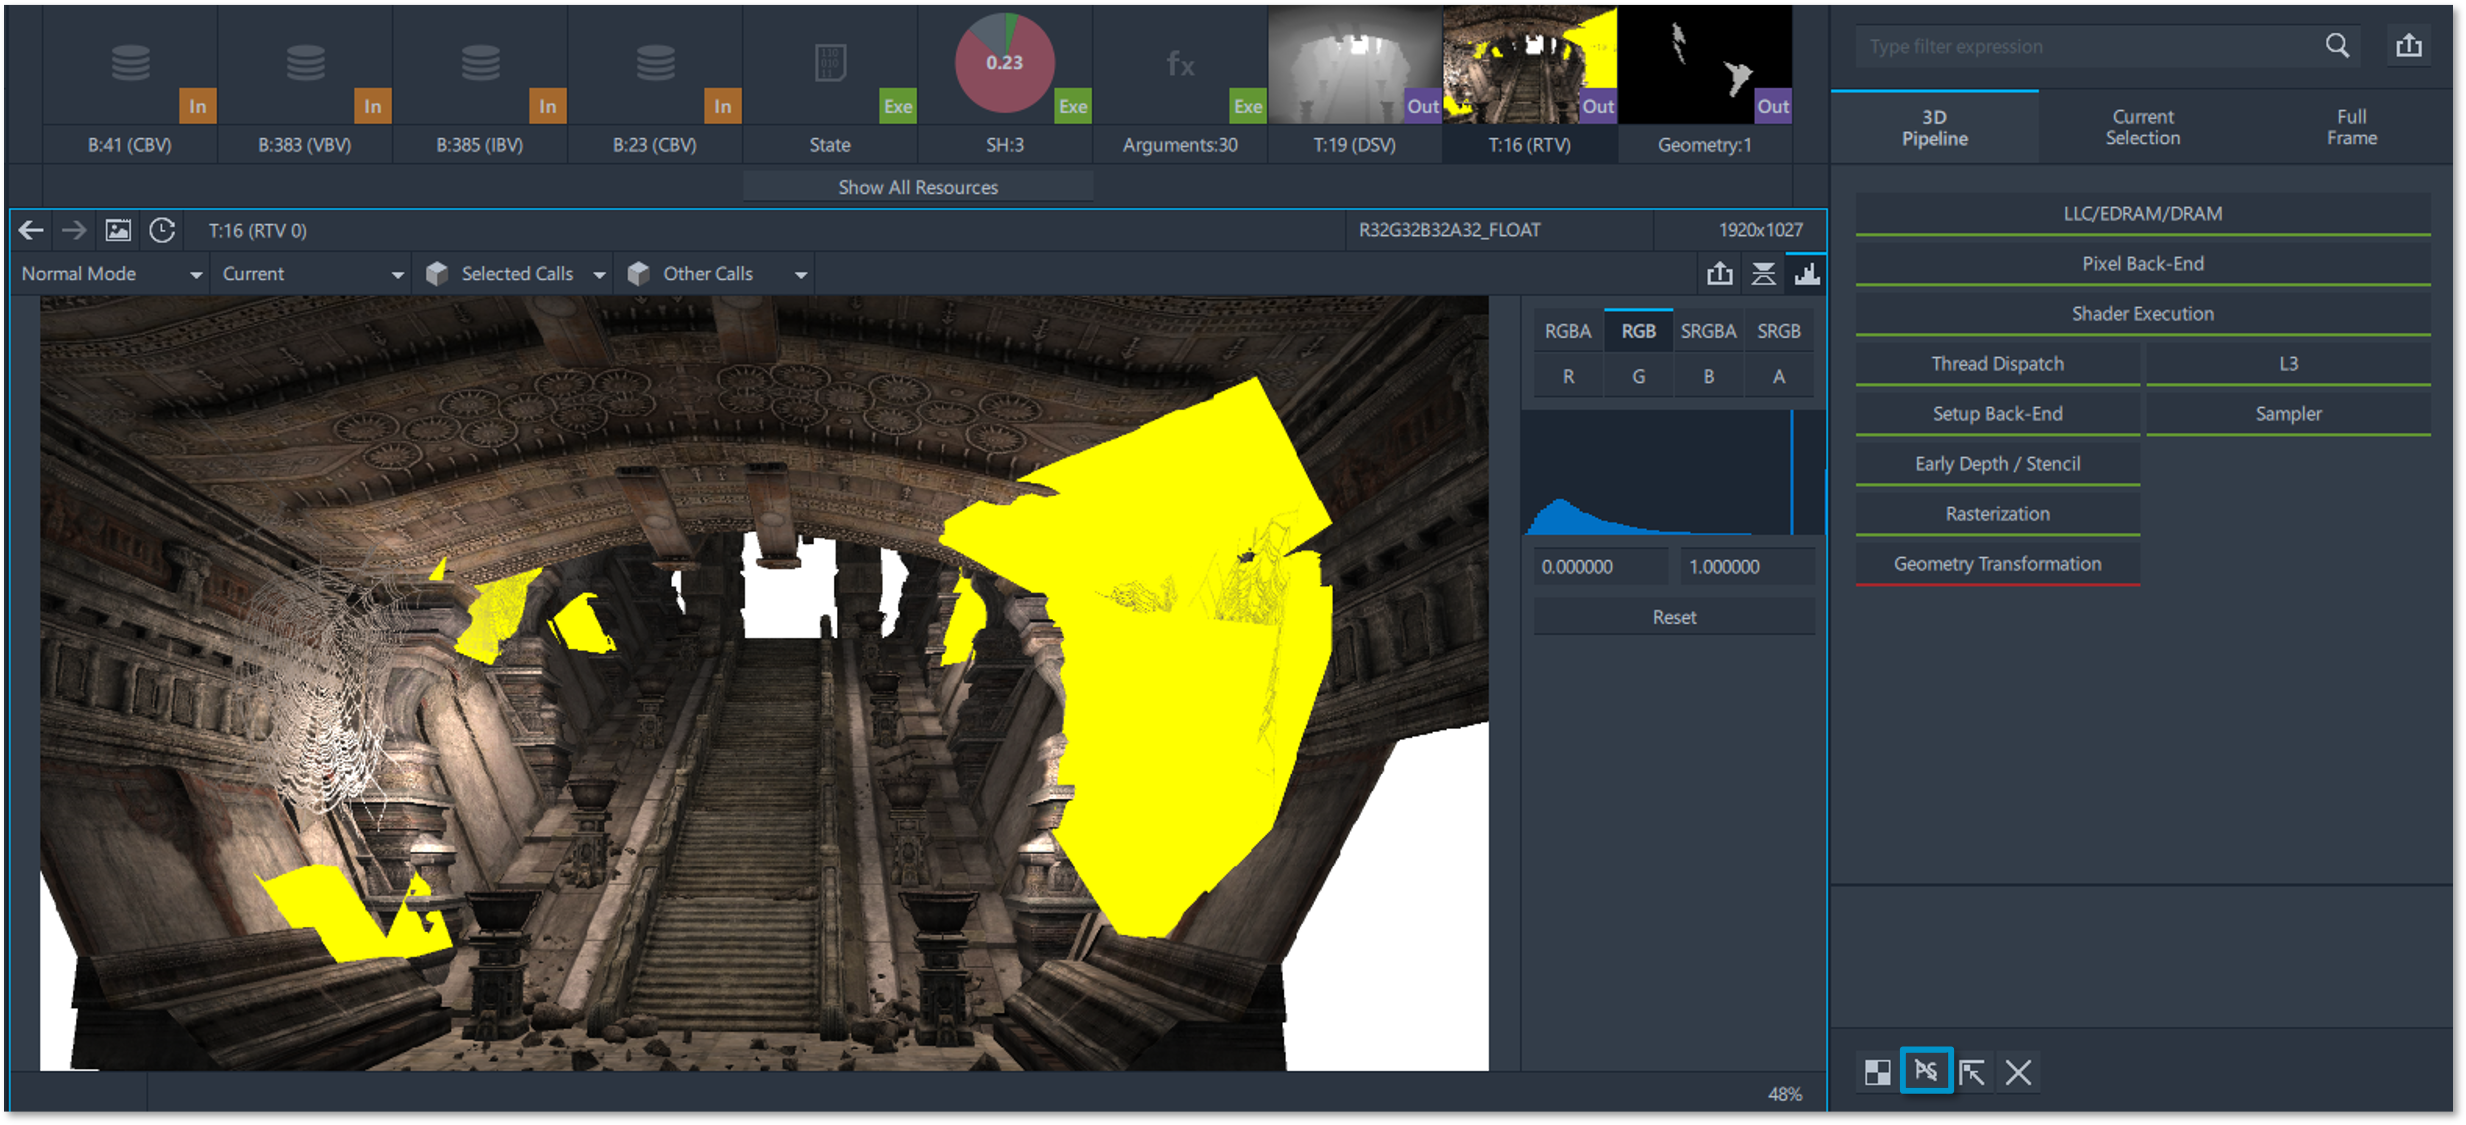
Applying the Simple Pixel Shader Override experiment replaces the pixel shader in the selected event with a simple pixel shader, writing a constant color to the output render target. If applying this experiment significantly improves the frame rate as a result, you can further analyze your shaders to see if you can reduce rendering time without detracting from the visual quality of your scene.
You can select a shader from the resource list in the center panel of the tool then click on the Hotspot button to enable the shader profiler feature. In this feature you can examine profiling information and analyze the efficiency of your shaders then go back and make any modifications to your HLSL or GLSL source code, then recompile your code to see if your frame rate improves.
One by One Scissor Rect Override
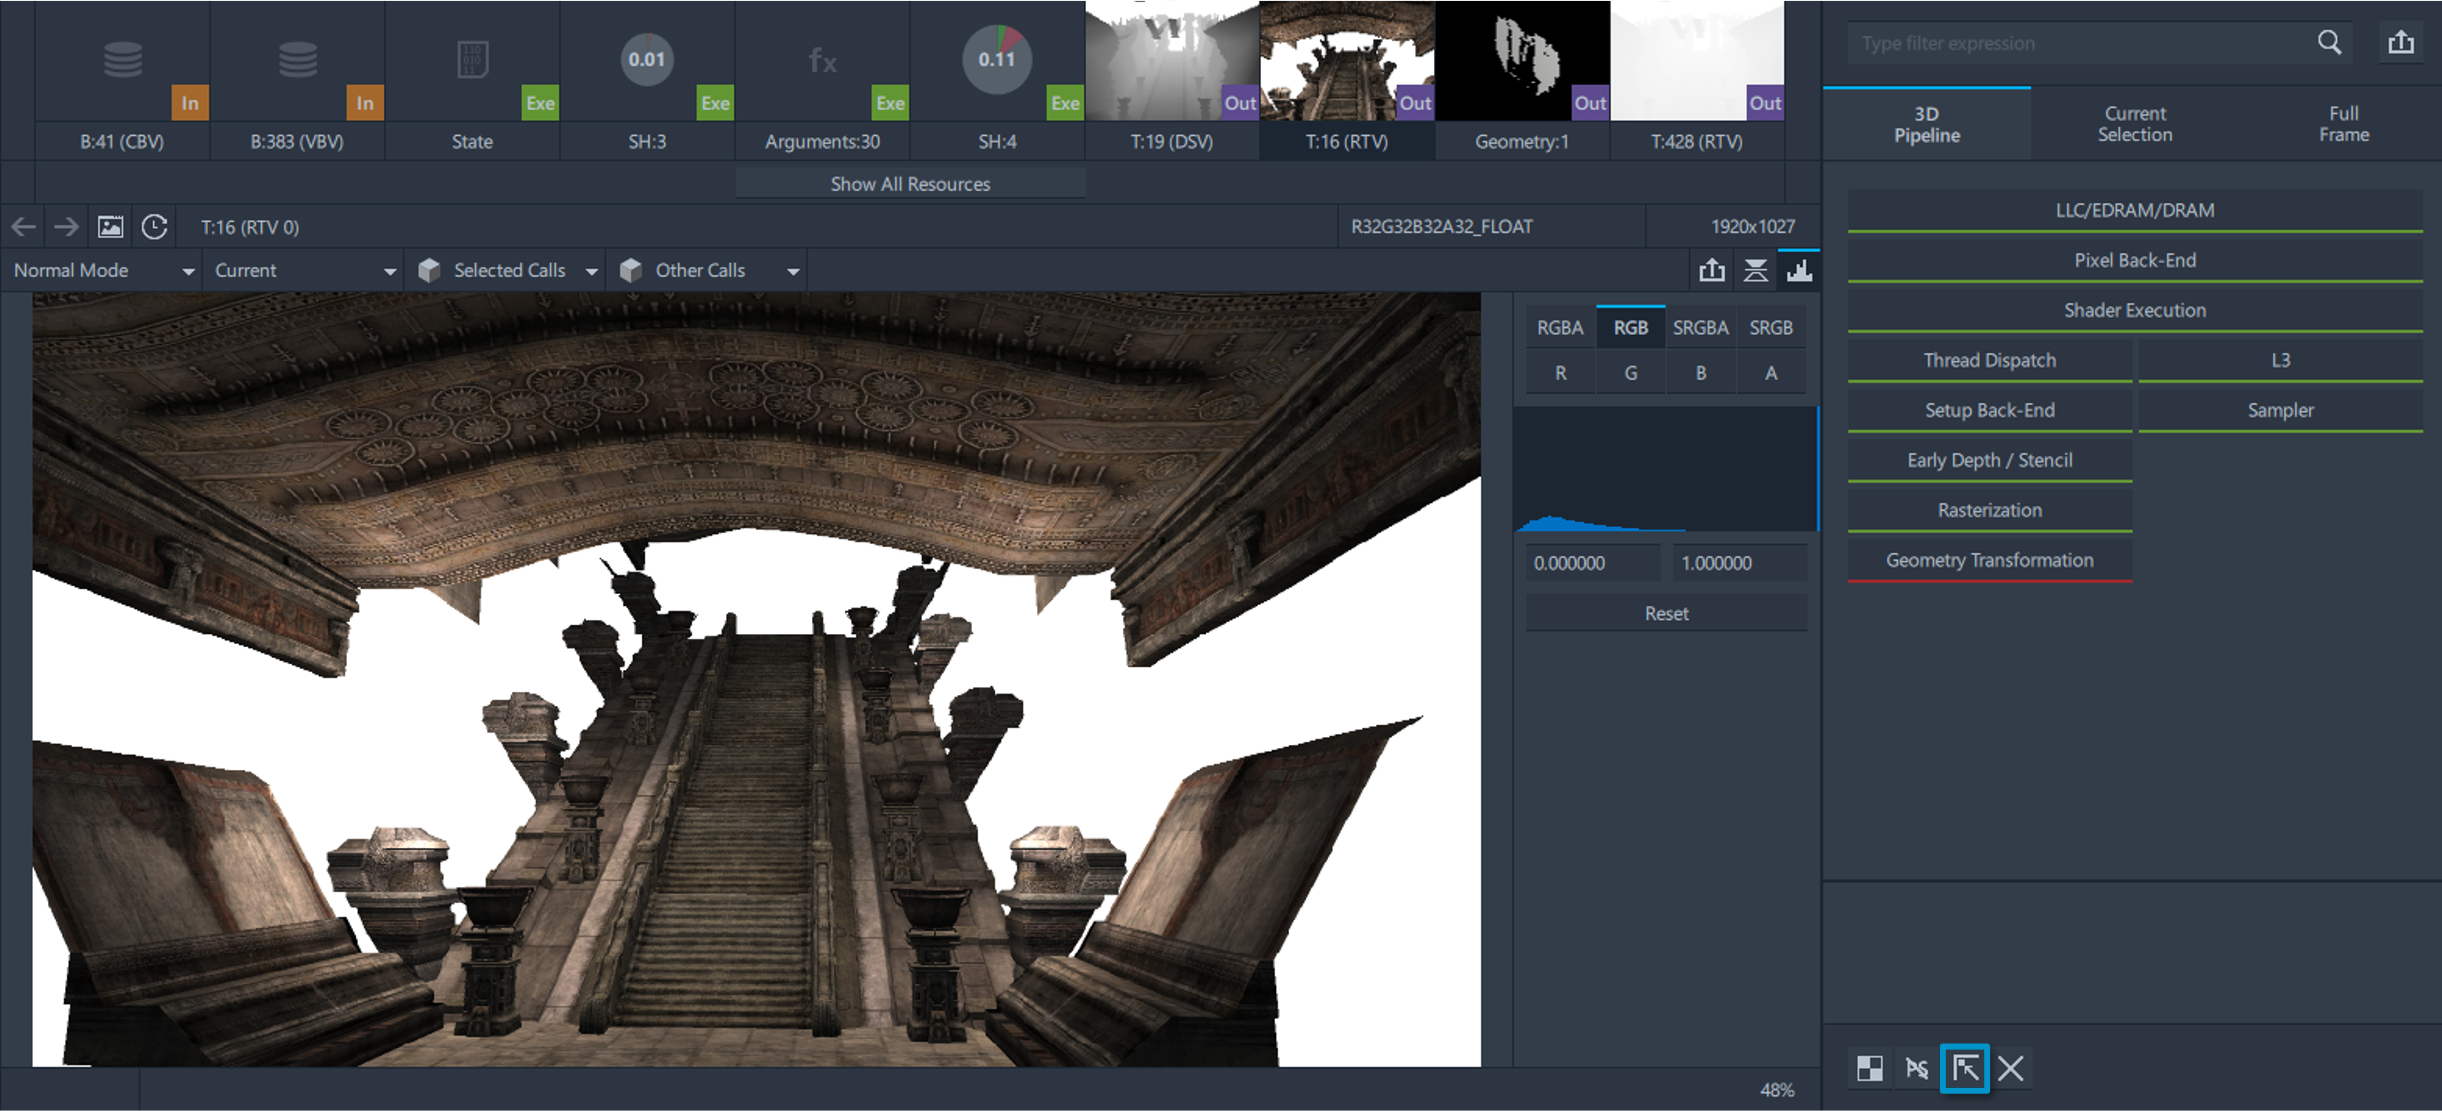
Applying the One by One Scissor Rect Override experiment will bypass pixel processing from the rendering pipeline. If the frame rate does not increase when this experiment is enabled, then a complex geometry or vertex shader is a bottleneck. Using the resource viewer, you can analyze the geometry of your frame or experiment with shader code to locate and solve potential issues. If the GPU duration significantly increases, then rasterization is likely a bottleneck.
NOTE: The effect of this experiment is driver and graphics hardware vendor specific and depends on whether scissoring occurs prior to or after the pixel shader stage.
Disable Events
Applying the Disable Events experiment prevents the selected events from being rendered.
Visual Impacts of Experiments
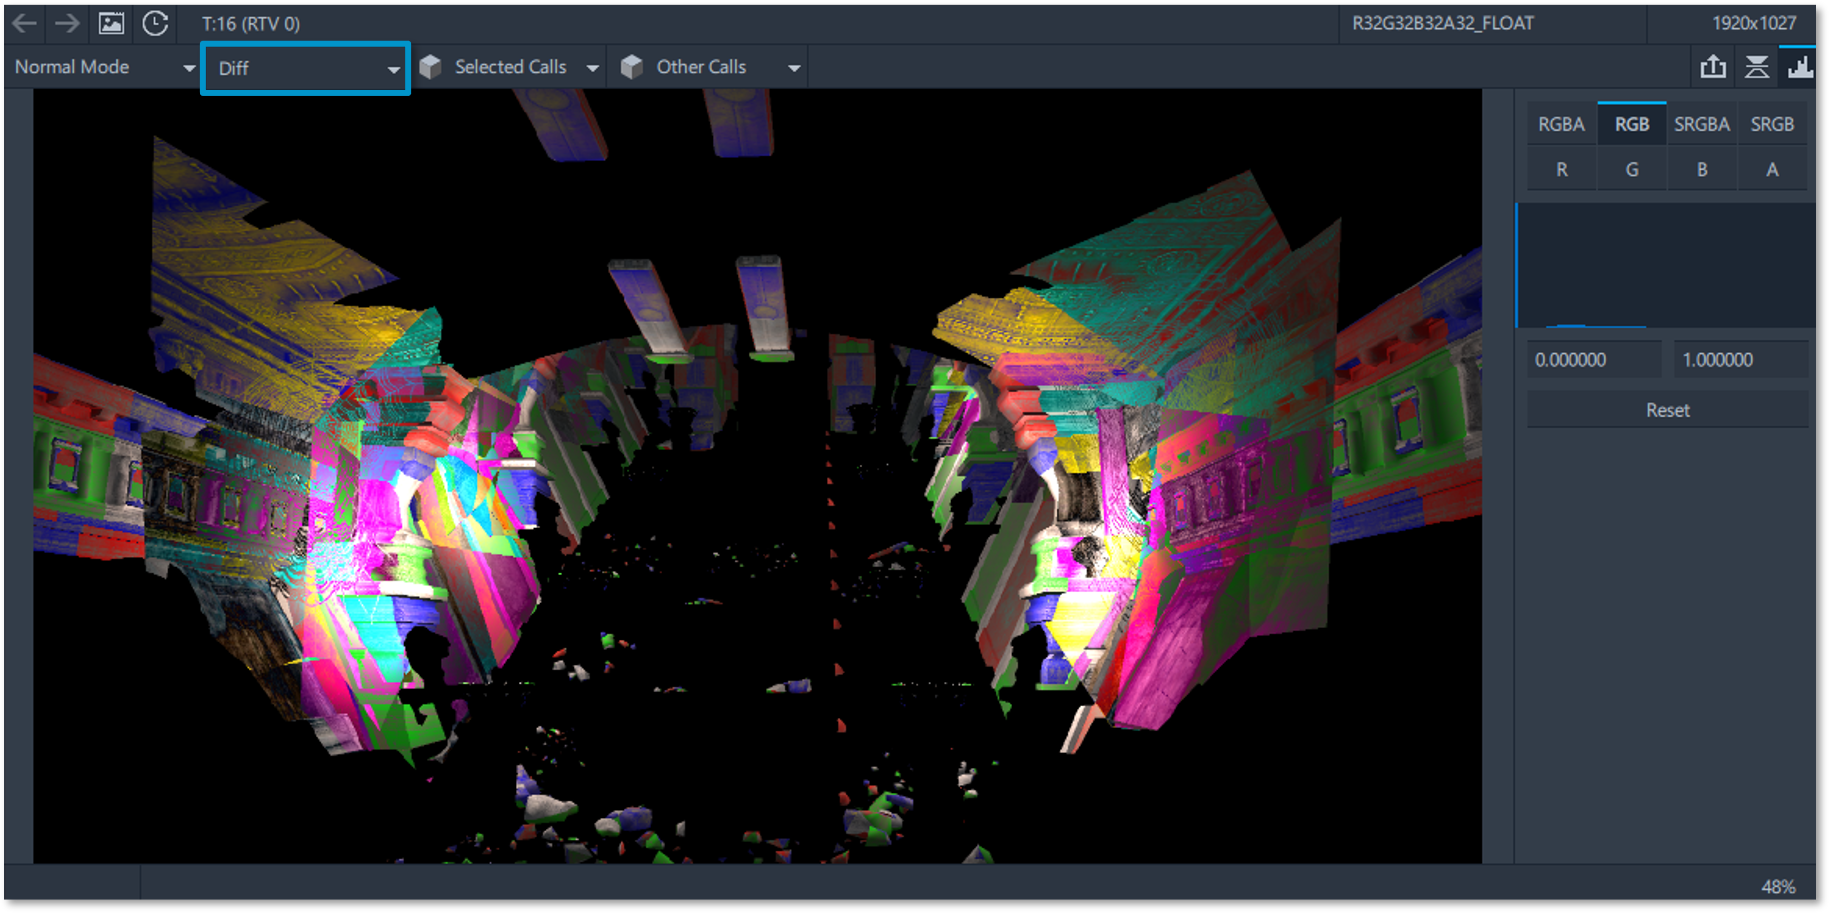
For each of these experiments, you can view the visual differences that the experiments made in the Resource Viewer of the tool. Selecting the Current mode option from the Output Visualization drop-down menu will display the render target with your experiment applied. Selecting the Original mode option will display your original render target before the experiment was applied. Finally selecting Diff mode will display the differences between the current render target with the experiment applied, and the original render target.
Performance Impacts of Experiments
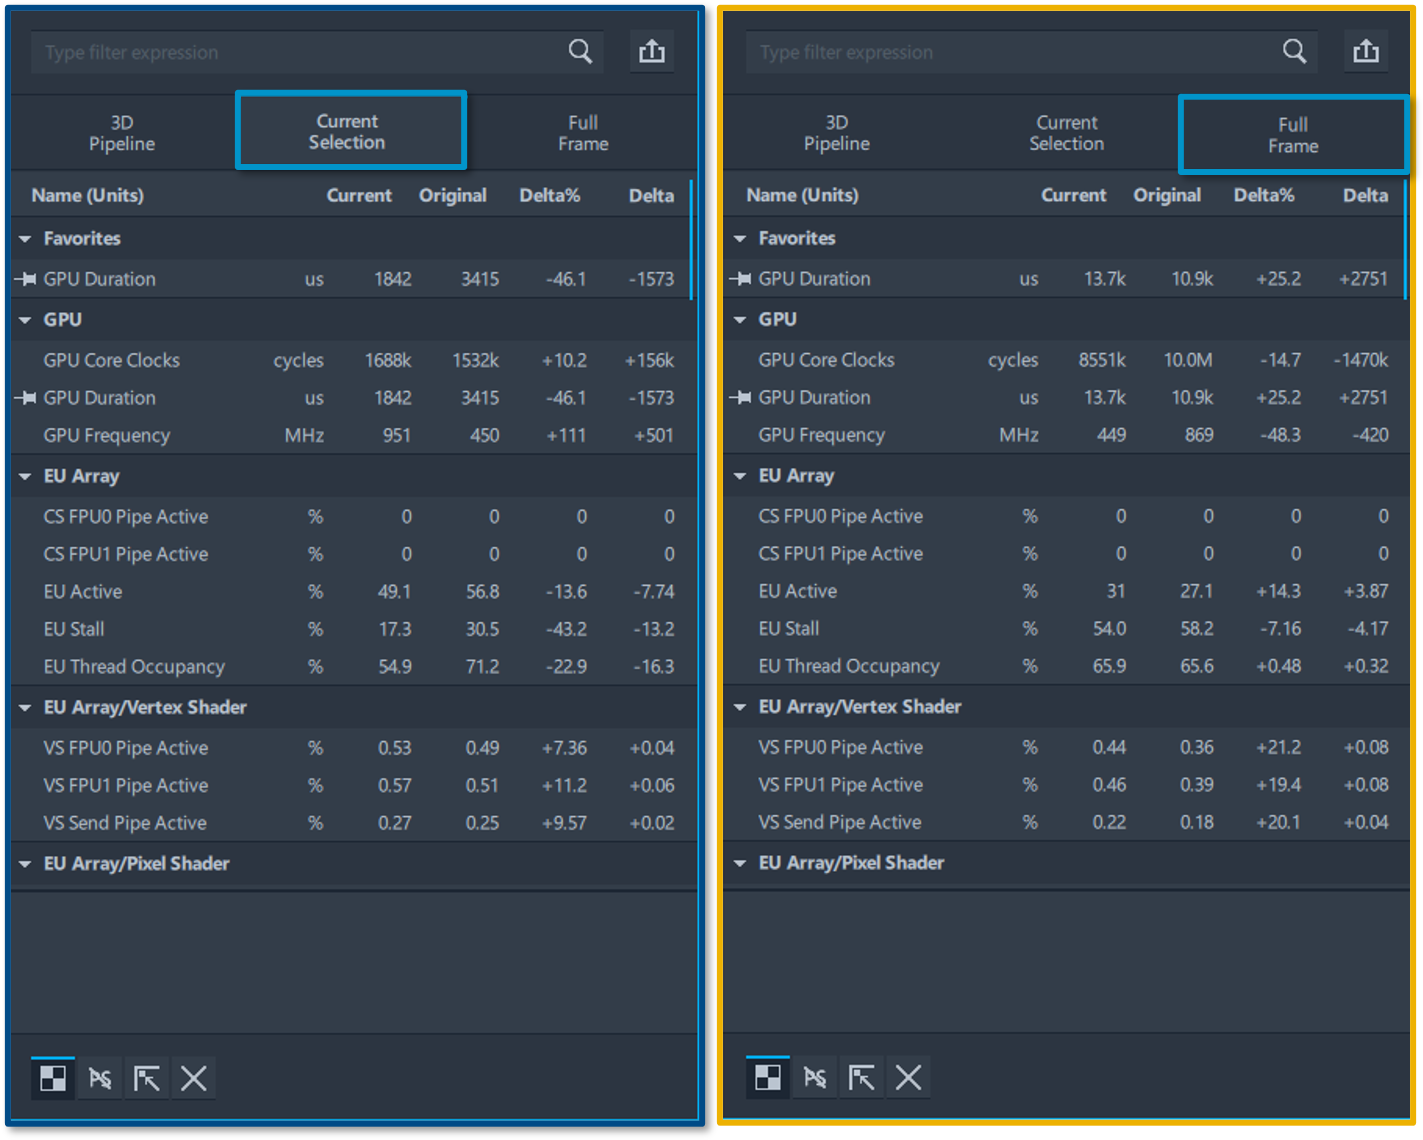
In the Metrics panel of the tool, you can view the performance impacts your experiments made on both the Full Frame and your Current Selection. You can compare your current metric data after your experiments have been applied, to your original metric data. You can also view the change in this data in percentage or that metrics unit of measurement, without any modifications to your applications code.
These performance impacts can also be viewed in the top left corner of the tool and are updated after each modification. To revert all changes through render state experiments you can press the Revert all Modifications button in the main toolbar of Graphics Frame Analyzer.
Conclusion
This article demonstrated how to perform render state experiments while inspecting a single frame in Graphics Frame Analyzer to isolate potential bottlenecks and areas of optimization in your applications. For more information on how to identify and analyze problem areas in your applications to resolve GPU performance regressions continue reading the Graphics Frame Analyzer Deep Dive articles.
Additional Resources
Part 1: Configure and Capture Frames (Article)
Part 2: Configure and Capture Multiple Frames (Article)
Part 3: Open and Explore Multiple Frames (Article)
Part 4: Open and Explore a Single Frame (Article)
Part 5: Working with the Bar Chart and API Log (Article)
Part 6: Exploring the Metrics Viewer (Article)
Part 7: Inspecting a Draw Call (Article)