Introduction
Intel® Graphics Performance Analyzers (GPA) offers a wide range of tools to analyze graphics applications across diverse workloads, platforms, and graphics APIs. Within Intel® GPA you can use Graphics Frame Analyzer to identify and analyze problem areas in your applications to resolve GPU performance regressions. This article will explore user interface features while examining a frame in the single frame view of Graphics Frame Analyzer which will aid in detecting bottlenecks while analyzing GPU bound applications. Topics covered in this article can be visualized in video format in the Open and Explore Single Frame View Deep Dive video, by checking reference markers in the images associated with this article.
Pre-requisites
Before proceeding with this article, ensure you have the minimum system requirements to successfully analyze graphics applications using Intel® GPA. Also make sure you have downloaded and installed Intel® GPA on your host platform.
Opening a Frame File
To open a single frame for analysis, select a single frame capture file in Graphics Frame Analyzer and press the Open button. You can also do this by opening a multi-frame stream file, selecting a frame or continuous range of frames that appears to be performing poorly and then pressing the Open button at the bottom of the left panel of the tool.
Main Toolbar
While a frame capture is open in Graphics Frame Analyzer you can view a variety of statistical information on your single frame in the top left-hand side of the tool in the main toolbar. This toolbar displays the following:
- The duration of the full frame in microseconds (1)
- The duration of the selected events in microseconds (2)
- The theoretical frame rate for the whole frame in frames per second (FPS) based on the duration (3)
- The time difference between the original and modified frame after render state experiments or frame resource modifications (4)
In this toolbar there are also several buttons on the top right-hand side of the tool including the following:
- Revert All Modifications: Used to reverse all modifications performed on your frame (5)
- Frame Info: Used to display system information on your frame (6)
- Settings: Used to modify the color and size of the user interface (7)
- Send Feedback: Used to send feedback to Intel GPA technical support (8)
- Help: Used to refer to online documentation (9)
NOTE: The numbers next to each of these options/buttons in the main toolbar match up to the image displayed below.

Visualization Panel
Just below the main toolbar you can view the visualization settings toolbar. This toolbar allows you to configure that data that’s displayed in the bar chart panel (directly below it) and in the API log. In the bar chart you can view the data that you configured in the visualization settings toolbar, scale up or down that data and view that data by its event or bottleneck type. The panel just below this allows you to navigate along the frame and select events that are displayed in the main bar chart by clicking and dragging the left or right control boundary and selecting the event or multiple events you want to view in greater detail.

API Log Panel
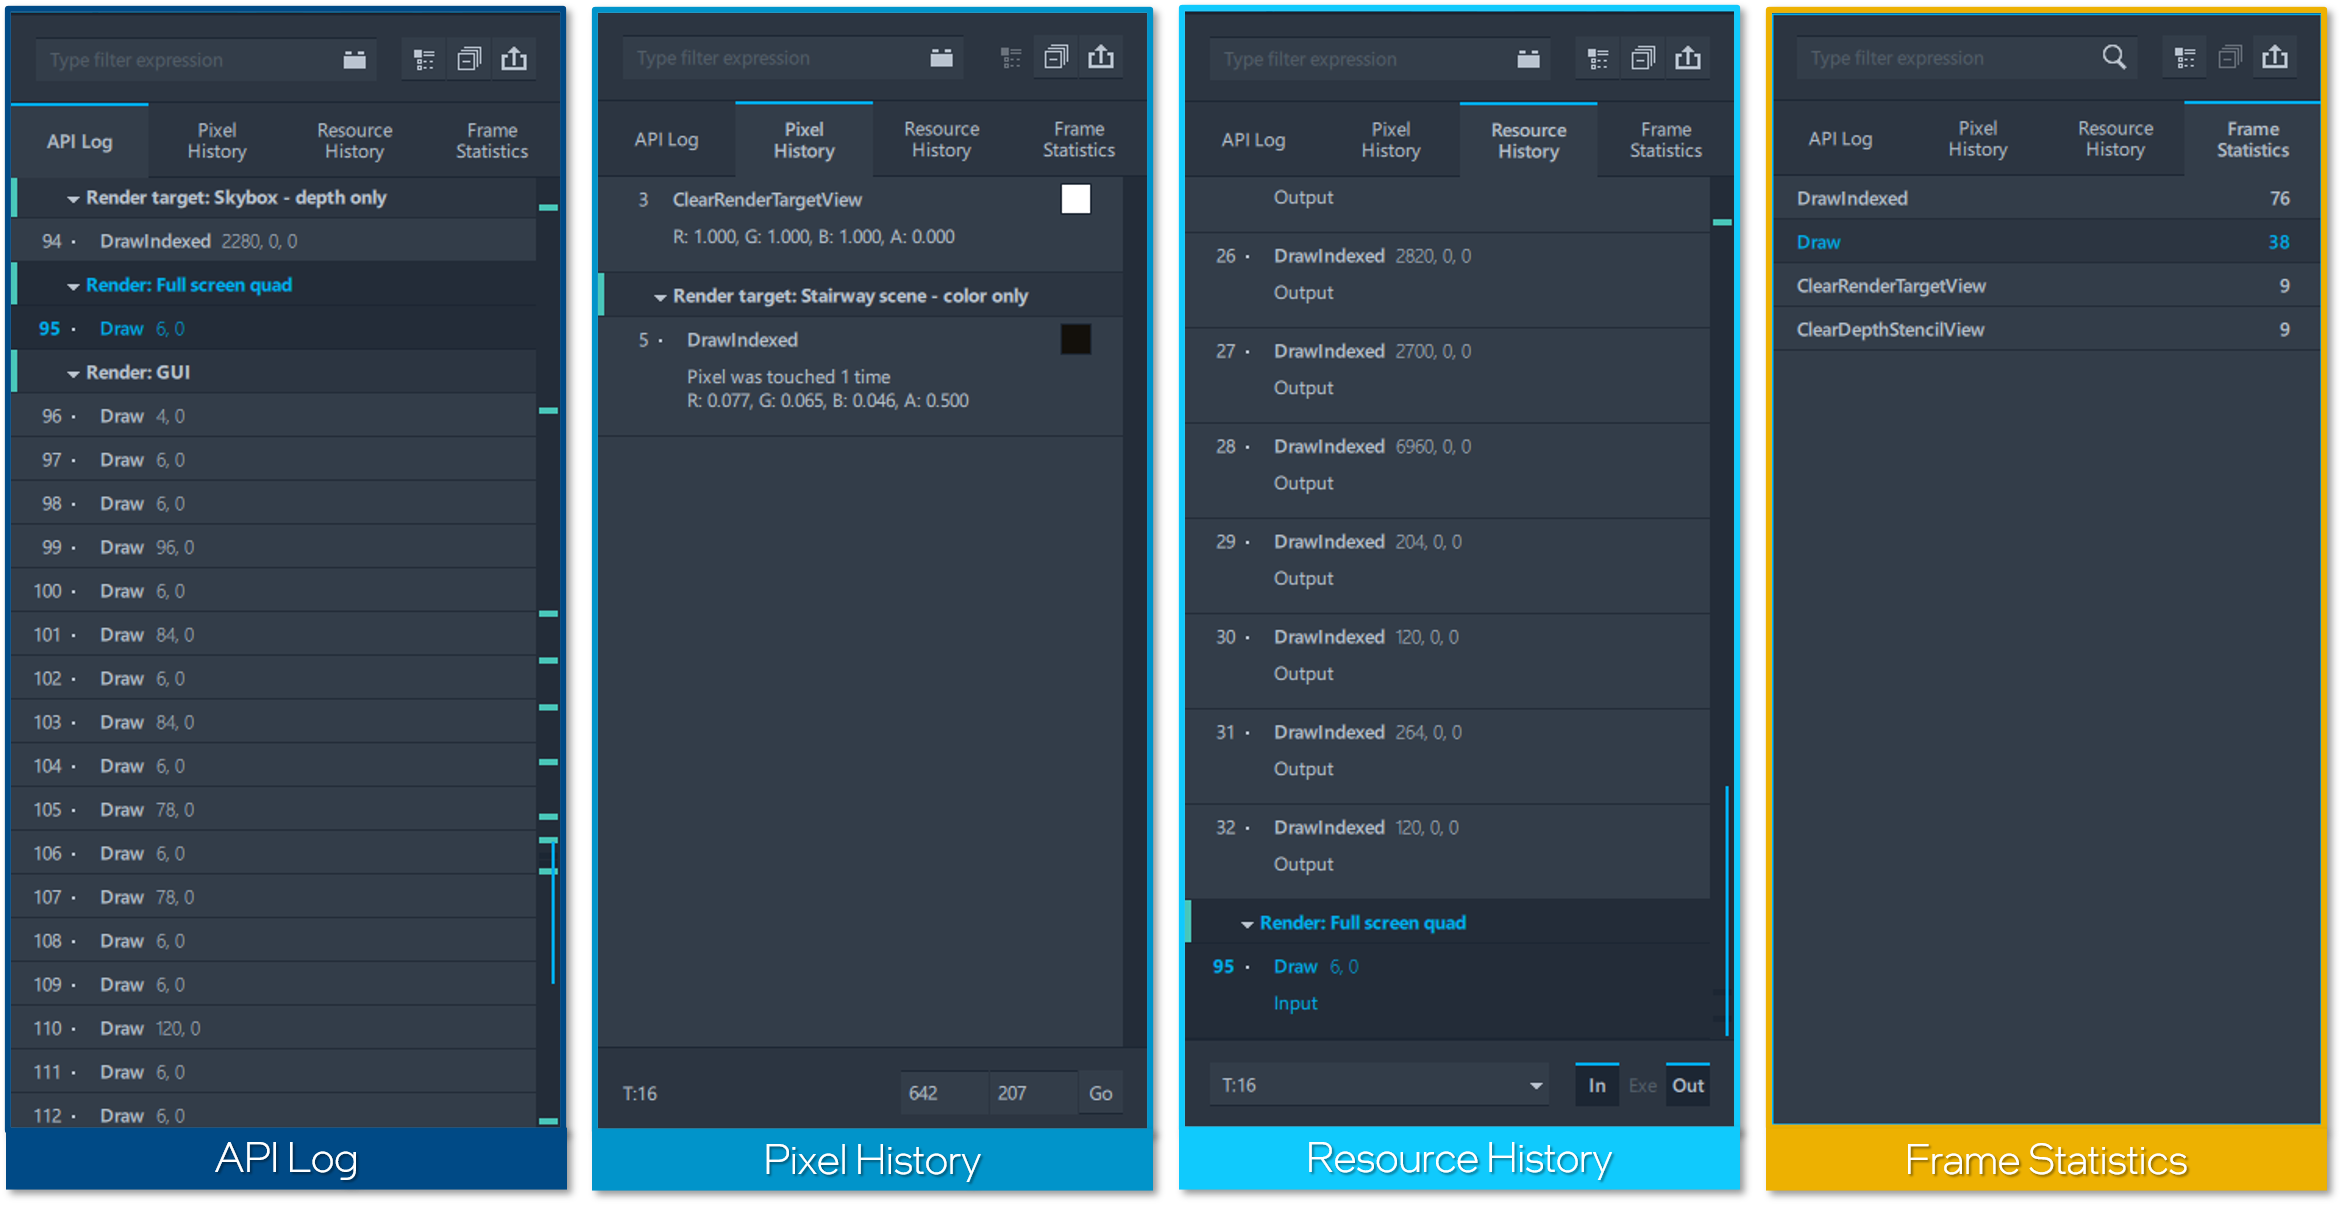
In the left panel of the tool you can view the API log which displays a list of all functions in their respective GPU execution order as well as the parameters passed to each function. Selecting an event in the main bar chart of the tool will highlight the corresponding functions in the API Log tabs. You can scroll up or down in this panel by either selecting a function from this panel and then pressing the up or down keys on your keyboard or by scrolling up or down using the mouse scroll wheel. You can filter graphics API functions by their name or parameters by clicking on the search bar at the top of this panel and typing in the event you want to search for. In this panel there are three other tabs including the following:
- Pixel History: Shows only the events that contribute to the pixel that the user selected in the resource viewer or specified manually in the bottom panel of the tool.
- Resource History: Shows only the events that use the response, which the user selected from the resource list. This tab can be enabled by pressing the Resource History button or double-clicking on any resource in the resource list or specified manually in the bottom panel of the tool.
- Frame Statistics: Shows the number of calls of each type in the frame.

Resource Panel
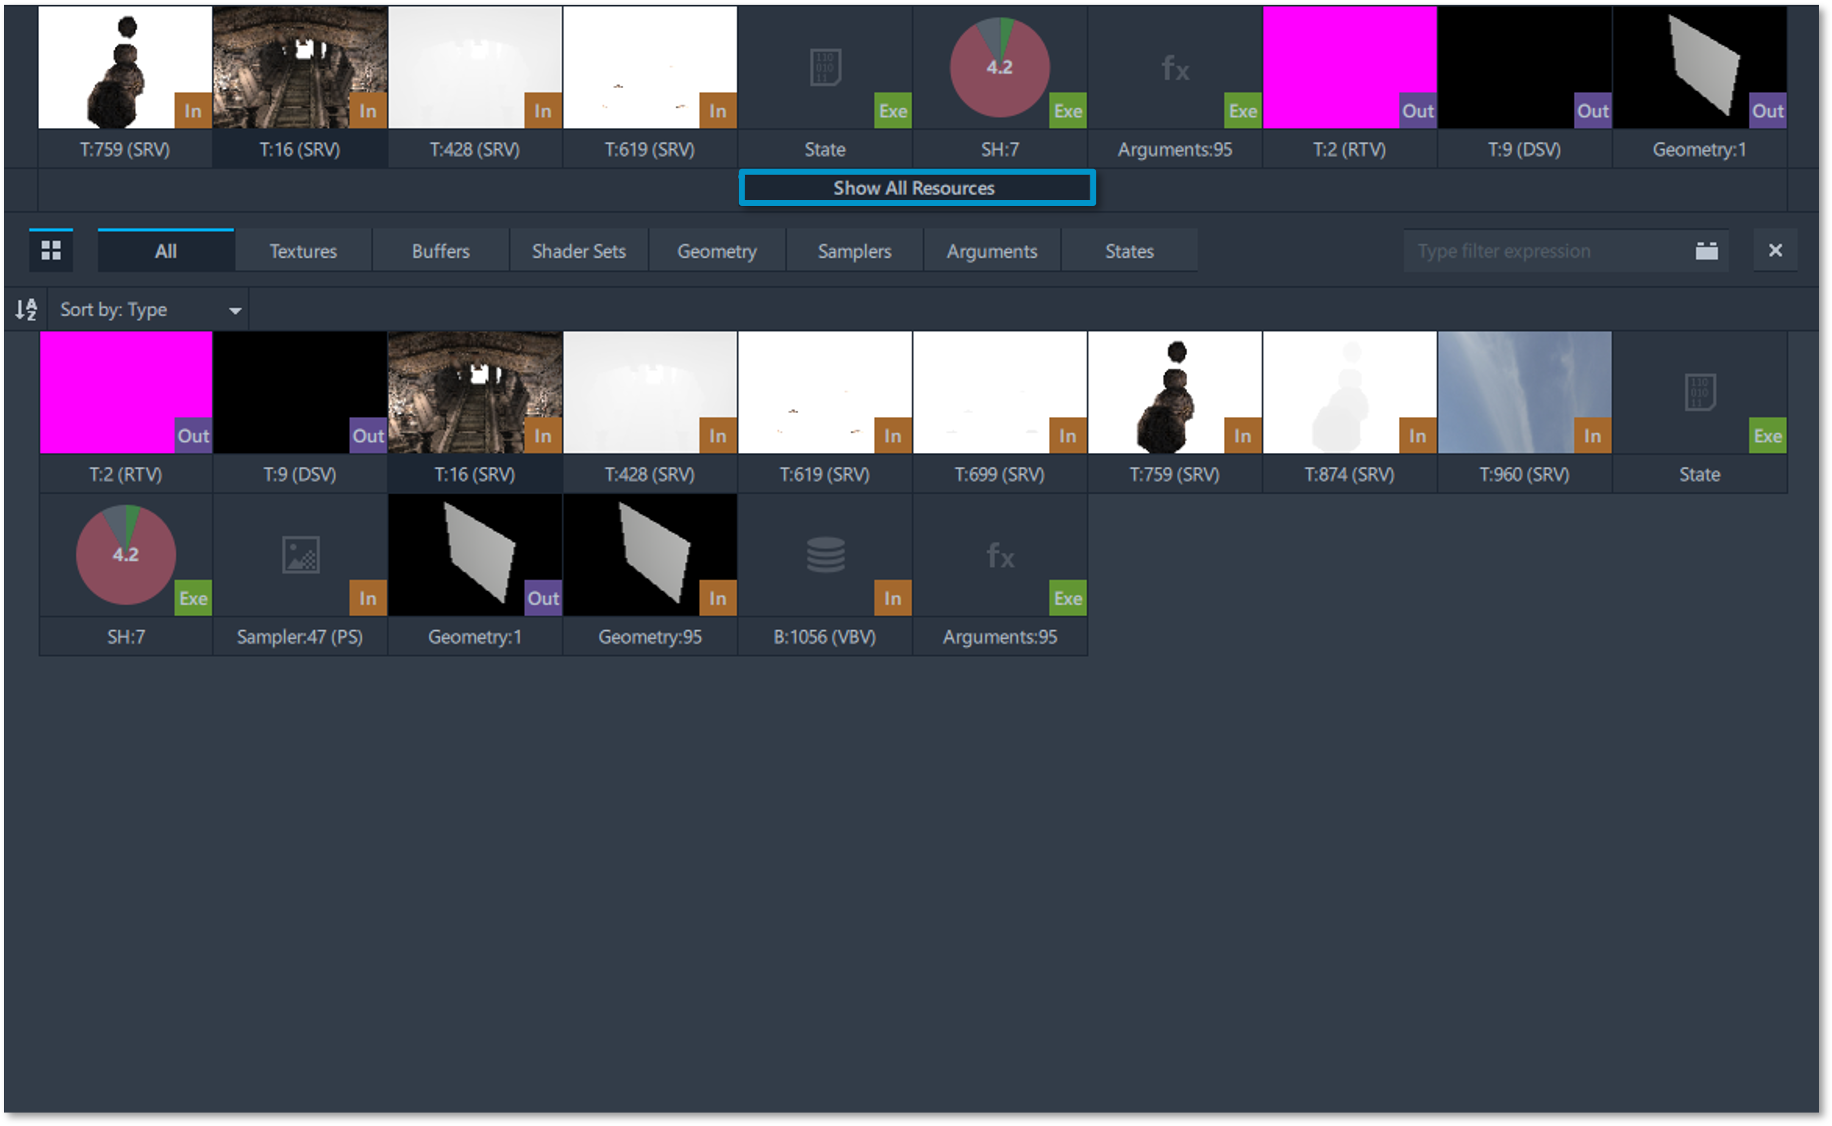
Selecting an event in the main bar chart or API log will allow you to inspect it further in the center panel of the tool. At the top of this panel you can view the resource list which displays all resources used by the selected graphics API functions. Clicking on the Show All Resources button will display details about the resources selected and allows you to view those resources based on their group. Clicking on a resource in this list will allow you to view details about that resource and at the same time all events that use that selected resource will be underlined in the main bar chart of the tool.

Metrics Panel
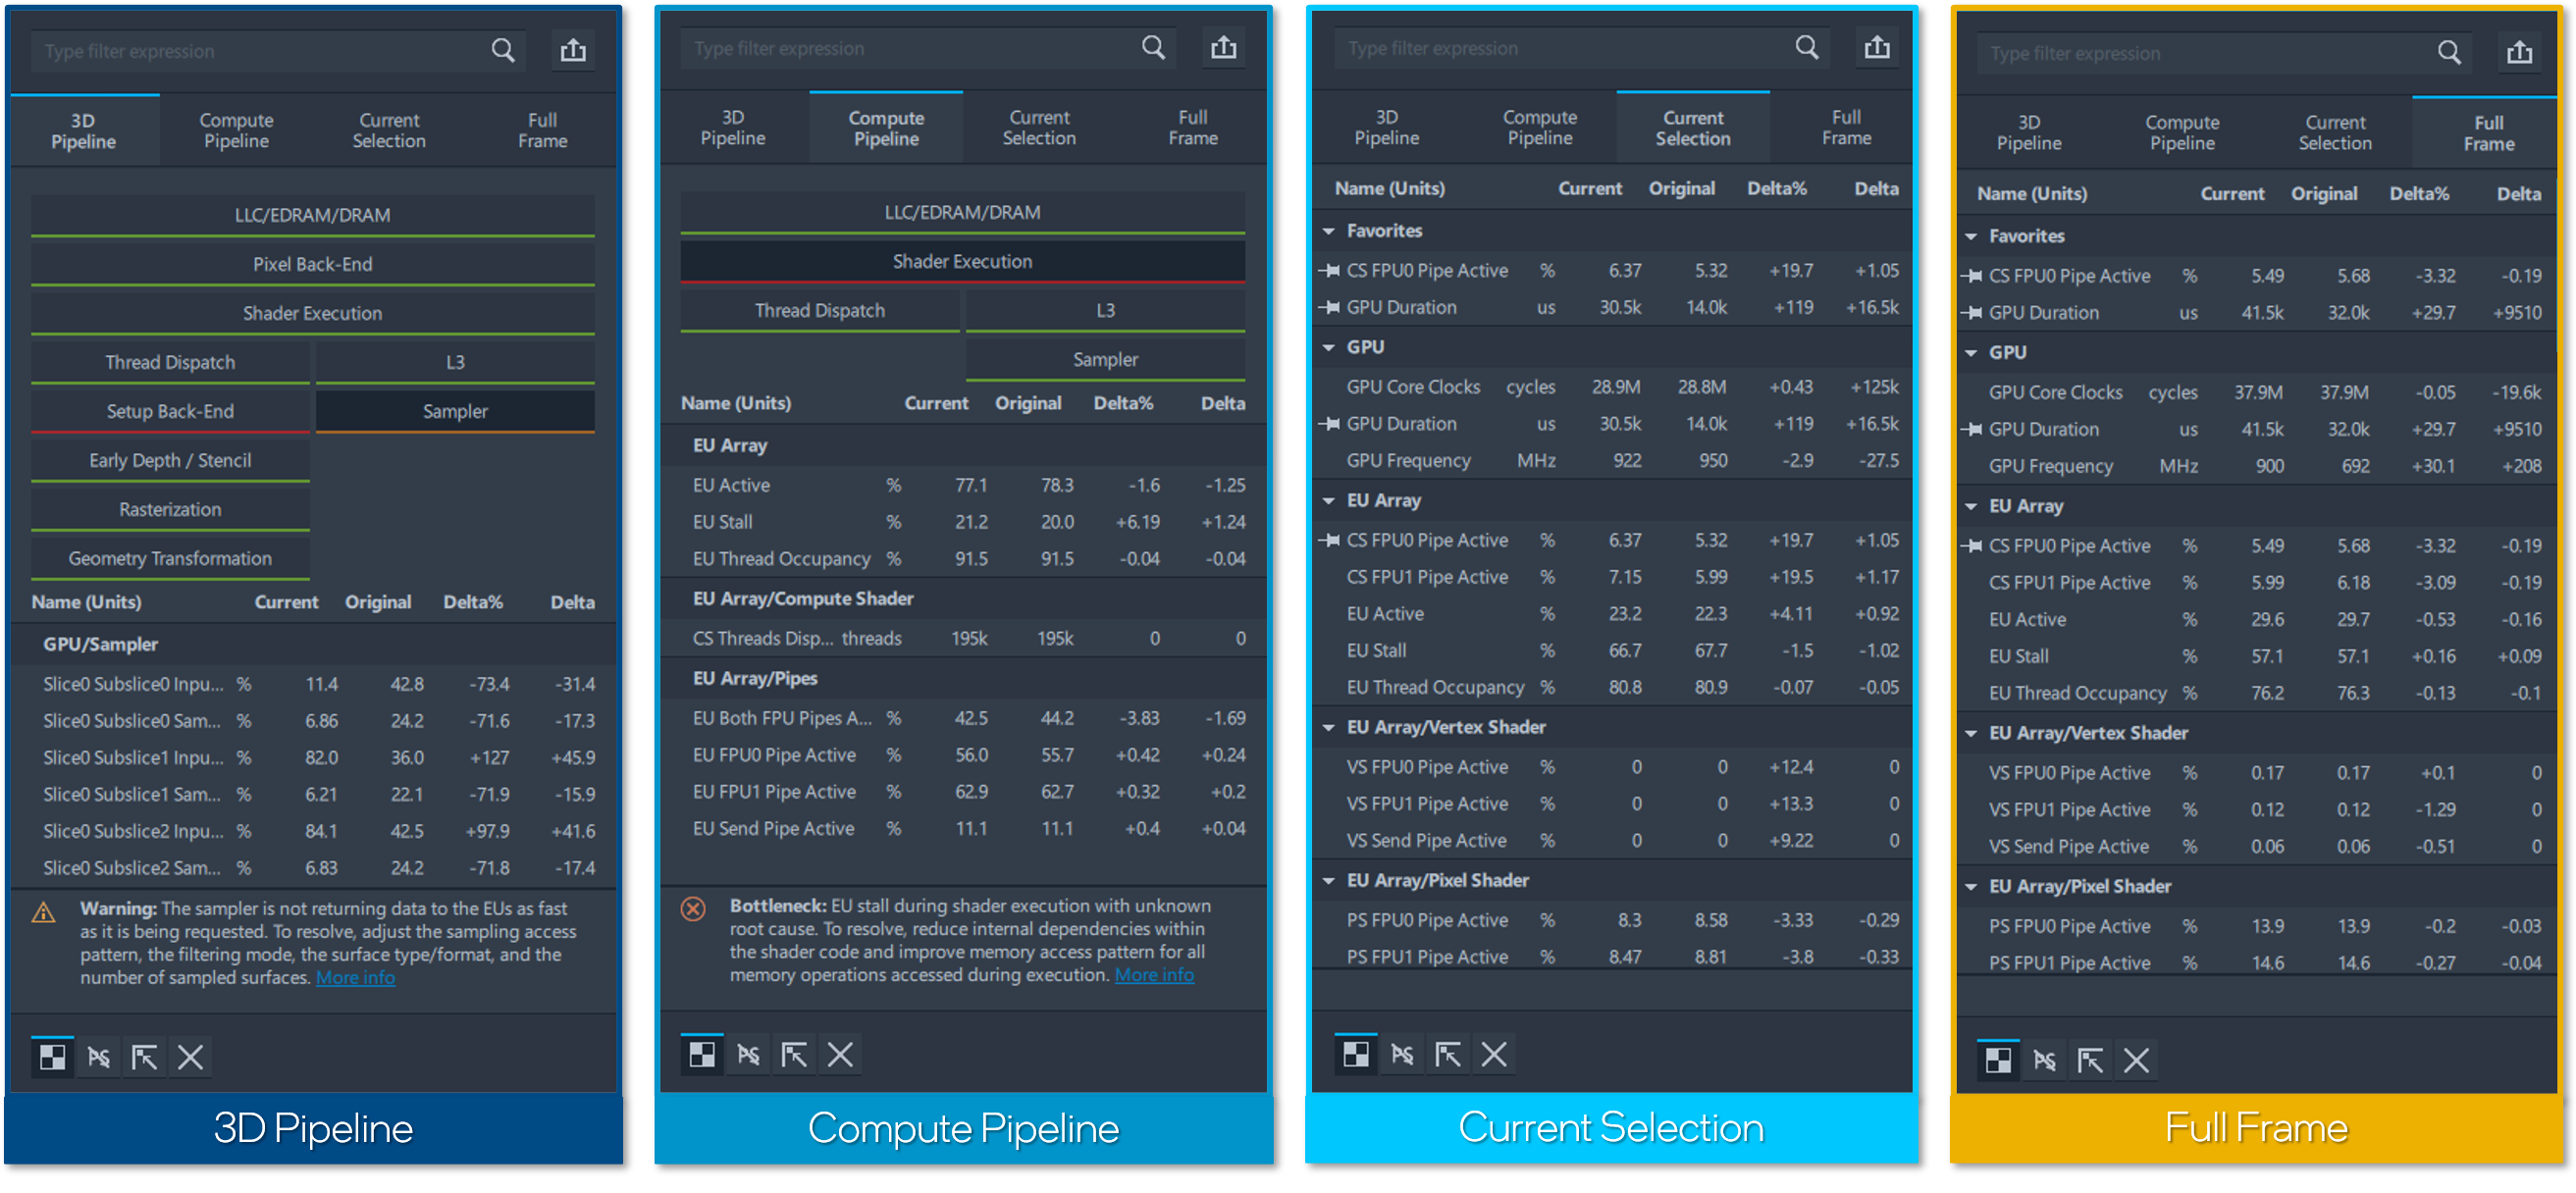
The right panel allows you to analyze metric information for the selected events and if no events are selected then it displays the total value for the entire frame.
NOTE: Hardware metrics are unavailable for non-Intel GPU’s, but API based metrics are available.
If using Intel GPU’s then this panel has four different tabs including the following:
- 3D Pipeline: Groups metrics by bottleneck types that are used for geometry rendering.
- Compute Pipeline: Groups metrics by bottleneck types that are used in computing processes.
- Current Selection: Displays metrics for the current selection.
- Full Frame: Displays metrics for the full frame.
NOTE: The 3D Pipeline and Compute Pipeline tabs are only available when your frame capture has draw or dispatch calls and those calls have been selected.
Clicking on each metric will display a detailed description of that metric at the bottom of this panel and this description box can be resized by clicking on the control boundary above the description. Clicking on each block in the 3D Pipeline and Compute Pipeline tabs will display information about bottlenecks and helpful resources on how to resolve those bottlenecks.

Conclusion
This article demonstrated how to open and explore a single frame file in the single frame view of Graphics Frame Analyzer while highlighting user interface features. For more information on how to identify and analyze problem areas in your applications to resolve GPU performance regressions continue reading the Graphics Frame Analyzer Deep Dive articles.
Additional Resources
Part 1: Configure and Capture Frames (Article)
Part 2: Configure and Capture Multiple Frames (Article)
Part 3: Open and Explore Multiple Frames (Article)
Part 4: Open and Explore a Single Frame (Video)
Part 5: Working with the Bar Chart and API Log (Article)
Part 6: Exploring the Metrics Viewer (Article)
Part 7: Inspecting a Draw Call (Article)
Part 8: Render State Experiments (Article)
Intel® Graphics Performance Analyzer Cookbook