Introduction
Intel® Graphics Performance Analyzers (GPA) offers a wide range of tools to analyze graphics applications across diverse workloads, platforms, and graphics APIs. Within Intel® GPA you can use Graphics Frame Analyzer to identify and analyze problem areas in your applications to resolve GPU performance regressions. This article will demonstrate how to use the center panel while analyzing a single frame in Graphics Frame Analyzer to inspect a draw call further and analyze the resources of that selected draw call to determine where optimization efforts are best spent. Topics covered in this article can be visualized in video format in the Inspecting a Draw Call Deep Dive video, by checking reference markers in the images associated with this article.
Pre-requisites
Before proceeding with this article, ensure you have the minimum system requirements to successfully analyze graphics applications using Intel® GPA. Also make sure you have downloaded and installed Intel® GPA on your host platform.
Bar Chart
While a single frame is open in Graphics Frame Analyzer, select a draw call from the Bar Chart of the tool and in the resource list of the center panel, you’ll be able to view all the resources used by that selected draw call. These resources are grouped into three categories:
- Input
- Execution
- Output

Configuring and Viewing all Resources
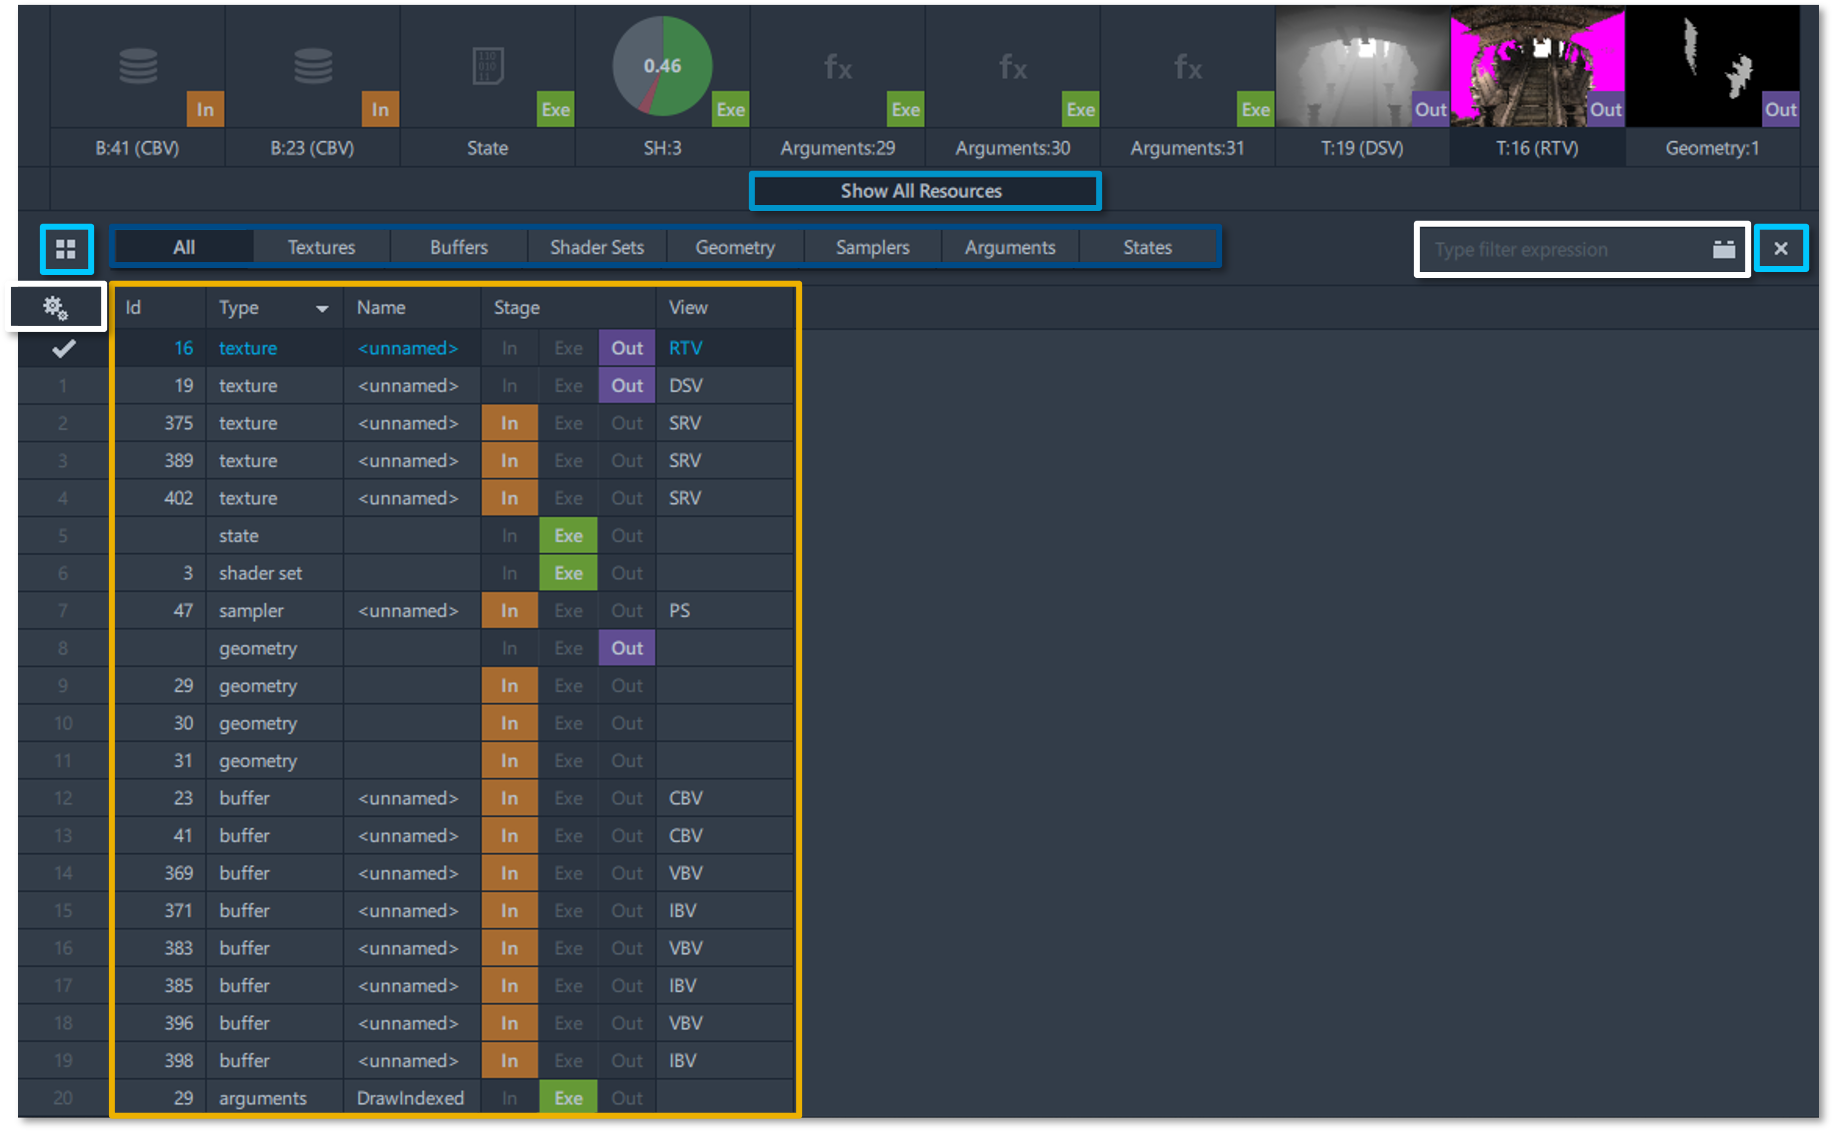
Clicking on the Show All Resources button just below the resource list will allow you to visualize a table of all resources used in your selected draw call. By default, with all resources selected you can view the following for each resource:
- ID
- Type
- Name
- Stage
- View
Clicking on each of these category names will allow you to sort your resources in either ascending or descending order based on that category. Clicking on the gear’s icon next to the ID category will allow you to alter which categories are displayed by pressing the toggle button next to the category name.
You can press the Tile View button to display your resources by their thumbnail, similarly allow you to sort these resources by clicking on the Sort By button, then selecting a category to sort by in the drop-down menu and then pressing the Sort Ascending toggle button to sort in ascending or descending order based on that category.
You can choose to limit the resources you’re viewing by the resource type, displayed in the form of tabs in the top of this panel. These types include:
- Textures
- Buffers
- Shader Sets
- Geometry
- Samplers
- Arguments
- States
You can filter your resources in this panel by typing in a keyword in the Filter Expression bar and only resources that contain your keyword will be displayed. Selecting a single resource will allow you to inspect the data associated with that resource in the resource viewer.
Texture Viewer
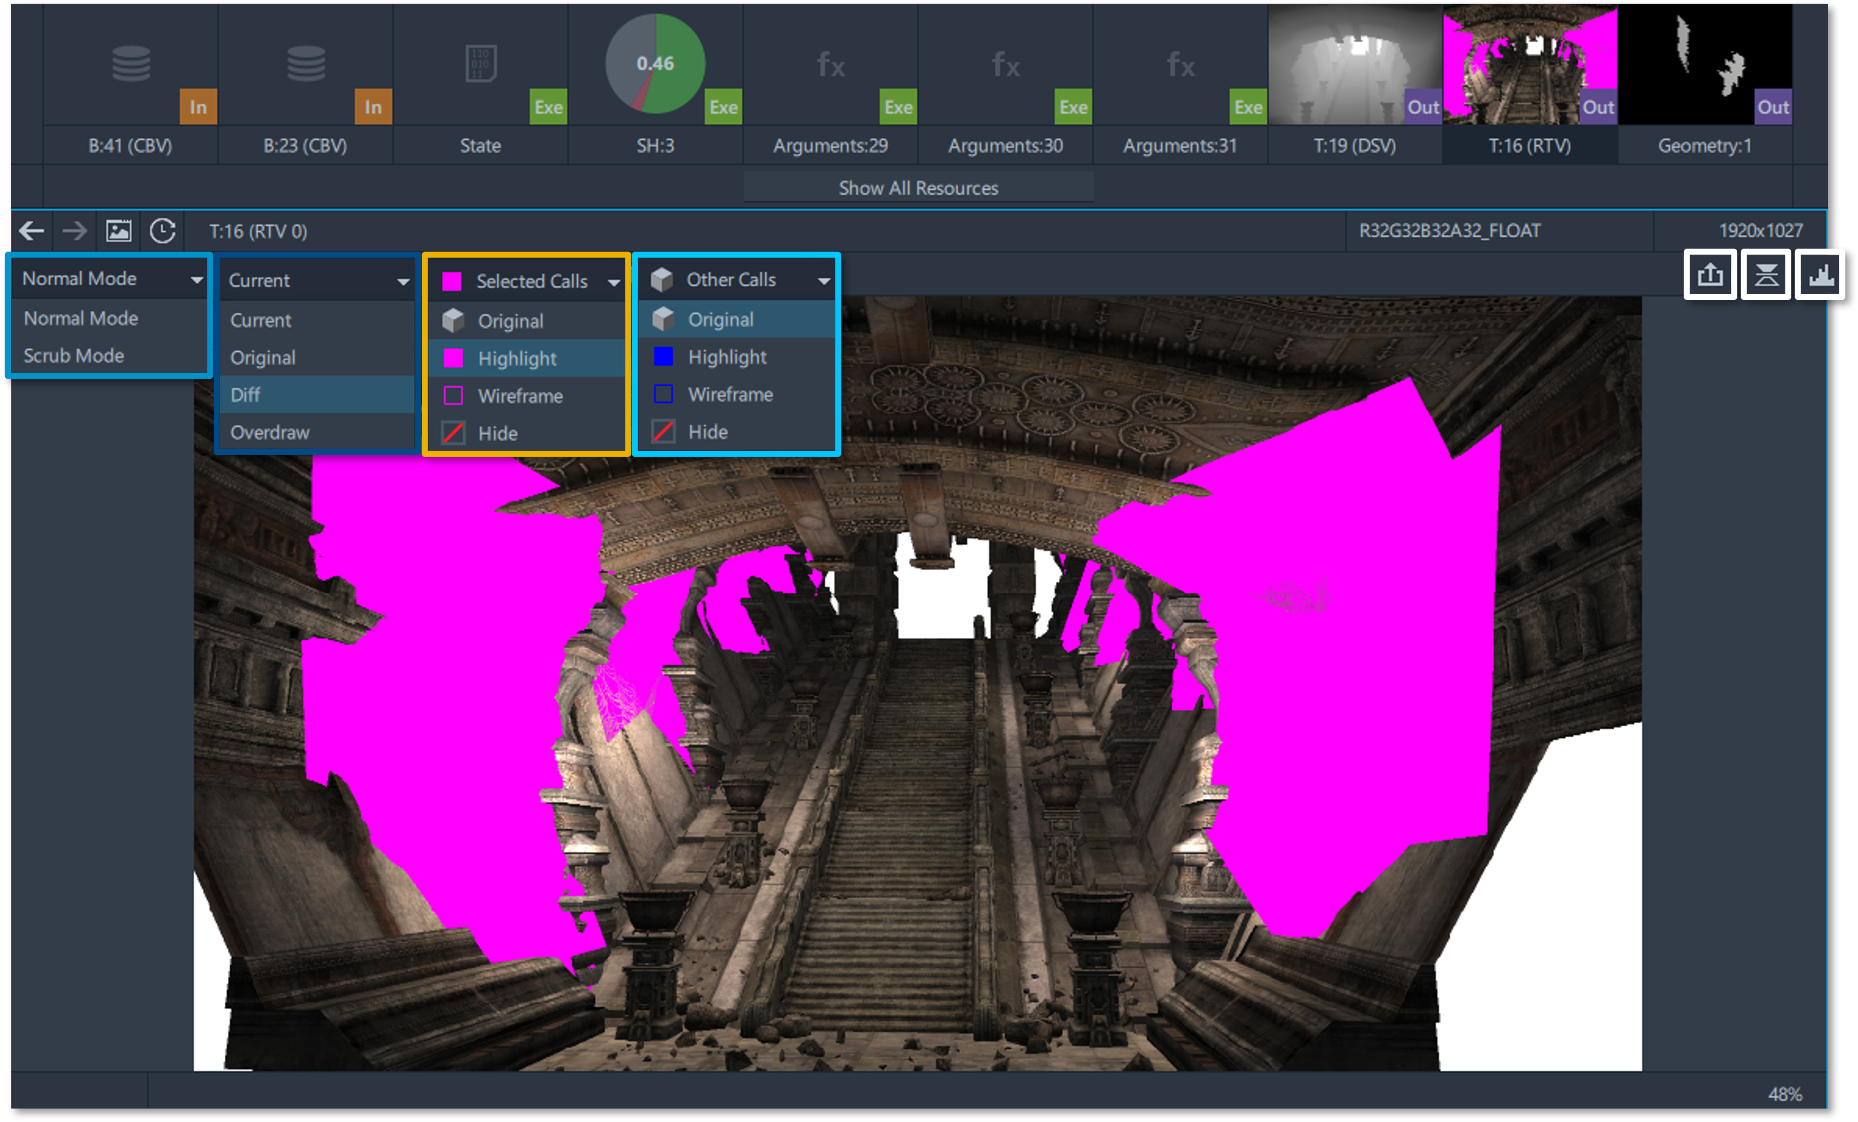
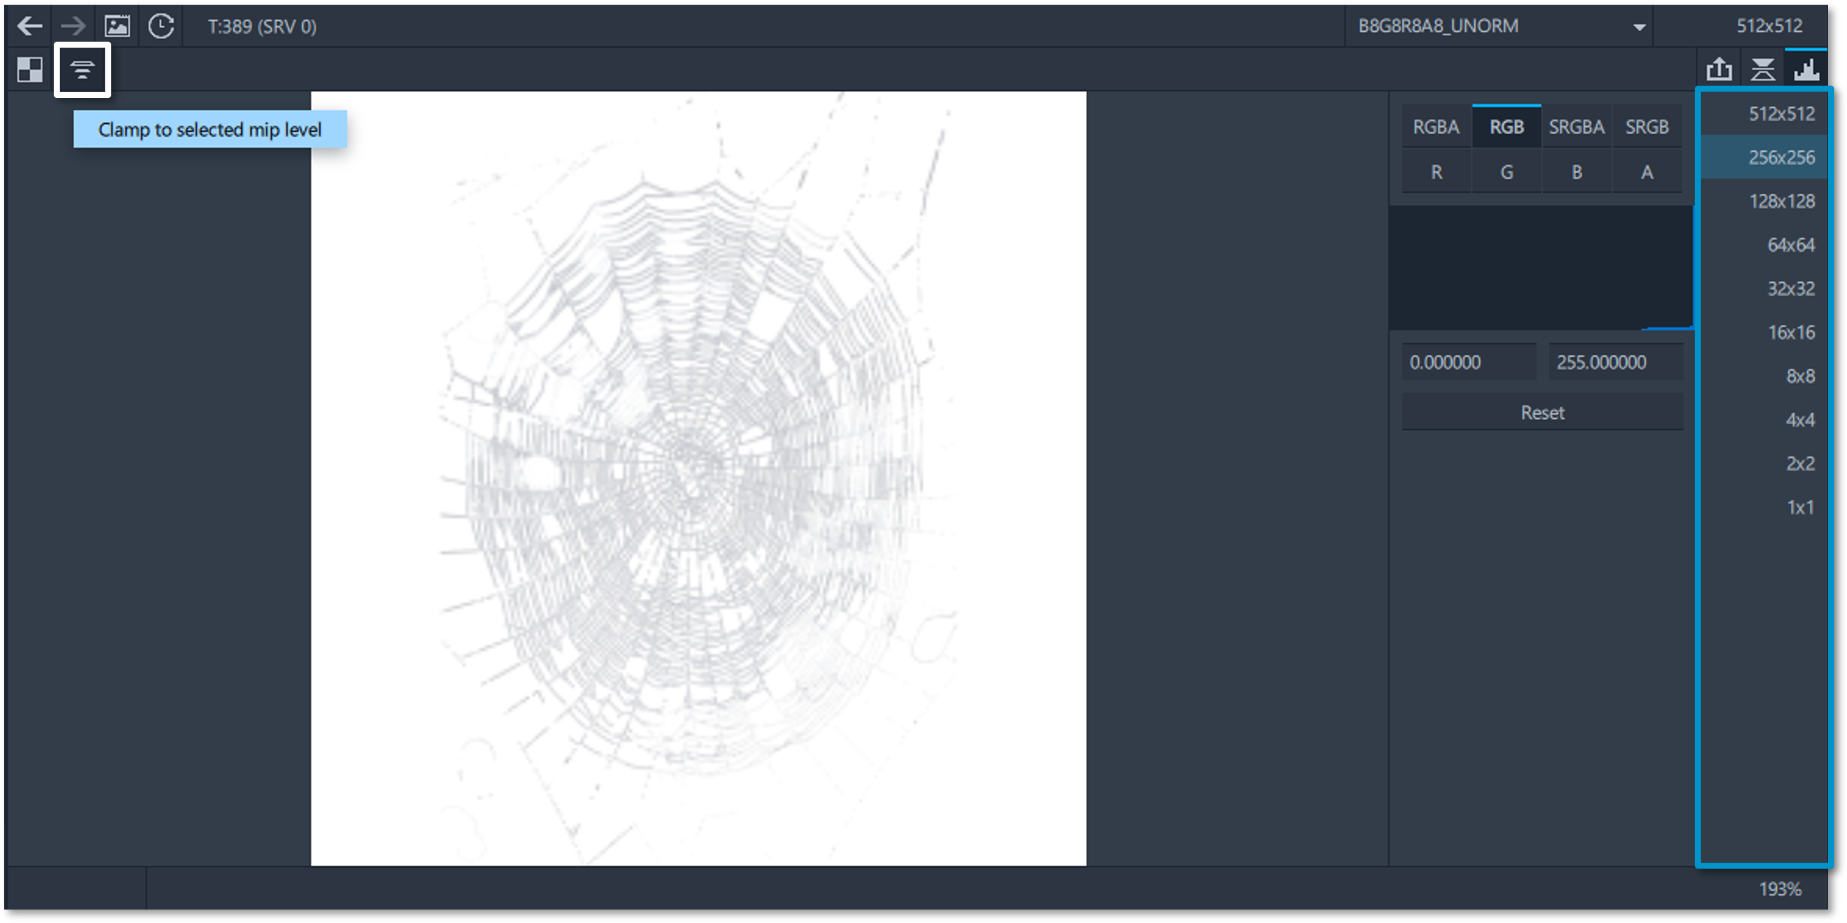
By default, once a draw call is selected you can view the texture of your render target in the resource viewer, setting what all selected events draw to a solid pink color.
Texture Viewer Toolbar
Above this panel is the Texture Viewer Toolbar containing several drop-down menus allowing you to modify what’s visualized in the resource viewer, including the following:
- Render Target State: This drop-down menu allows you to toggle between two different modes.
- Normal Mode: Displays the render target state for the last event in the render target region, where the current selected render target is located.
- Scrub Mode: Displays the render target state for the current selected event.
- Output Texture Visualization Mode: This drop-down menu allows you to switch between viewing modes of the selected output texture and contains four different modes.
- Current Mode: Displays the render target with modifications.
- Original Mode: Displays the render target without modifications.
- Diff Mode: Displays the difference between the current and original render target.
- Overdraw Mode: Displays the render target with a blue scale overdraw visualization. The brighter the color the more times the pixel was updated.
NOTE: If no experiments have been applied to your selected draw call(s) then the current mode is equal to the original mode.
- Selected Calls: This drop-down menu allows you to alter how the selected draw call is rendered and contains four different options.
- Original: Displays what all selected events rendered without any modifications.
- Highlight: Displays what all selected events rendered in a pink color.
- Wireframe: Displays what all selected events rendered in a wireframe.
- Hide: Hides all selected events from view.
- Other Calls: This drop-down menu allows you to switch between four different options to display non-selected calls.
- Original: Renders all non-selected events without any modifications.
- Highlight: Sets all non-selected events to a solid blue color.
- Wireframe: Displays all non-selected events in a wireframe.
- Hide: Hides all non-selected events from view.
In this toolbar you can also save a texture image or render target either in the DirectDraw Surface, Khronos Texture, or PNG formats by pressing the Save Texture to File button. You can turn the texture or render target upside down by pressing the Flip Image button, in case you have an intermediate render target which was rendered upside down.
Altering Histogram Values
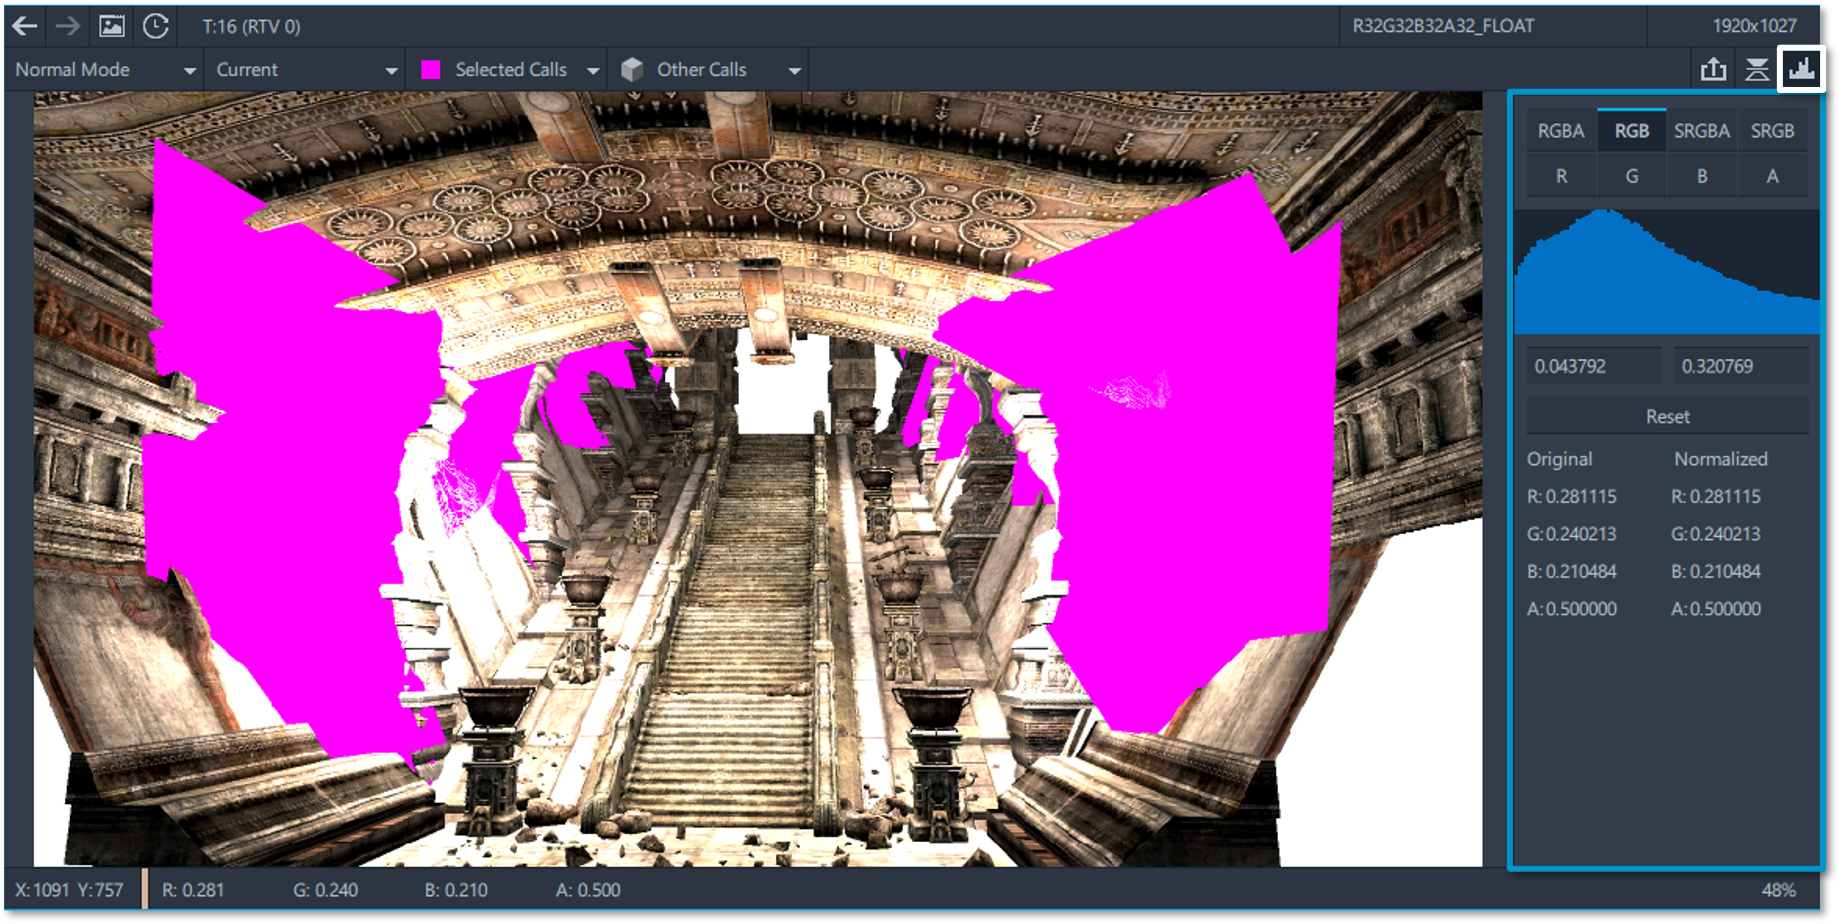
You can open a colored histogram of the texture or render target by pressing the Histogram button. After pressing this button, you can select a color range which contains relevant data by clicking and dragging with your mouse in the histogram or by typing its threshold values in the Range Selector just below the histogram and the texture content will be normalized based on your specified threshold values. You can zoom out of the selected range using the mouse wheel and scroll left or right by clicking and dragging the mouse wheel while holding down the CTRL key on your keyboard. To return to the default range click on the Reset button just below the range selector and you will notice your histogram values change accordingly to the texture format. You can hover over or click on a pixel in your texture to view detailed information about the pixel values below the histogram, displaying the original values used to store pixel information in memory and the normalized values used in shaders.
Selecting a Pixel
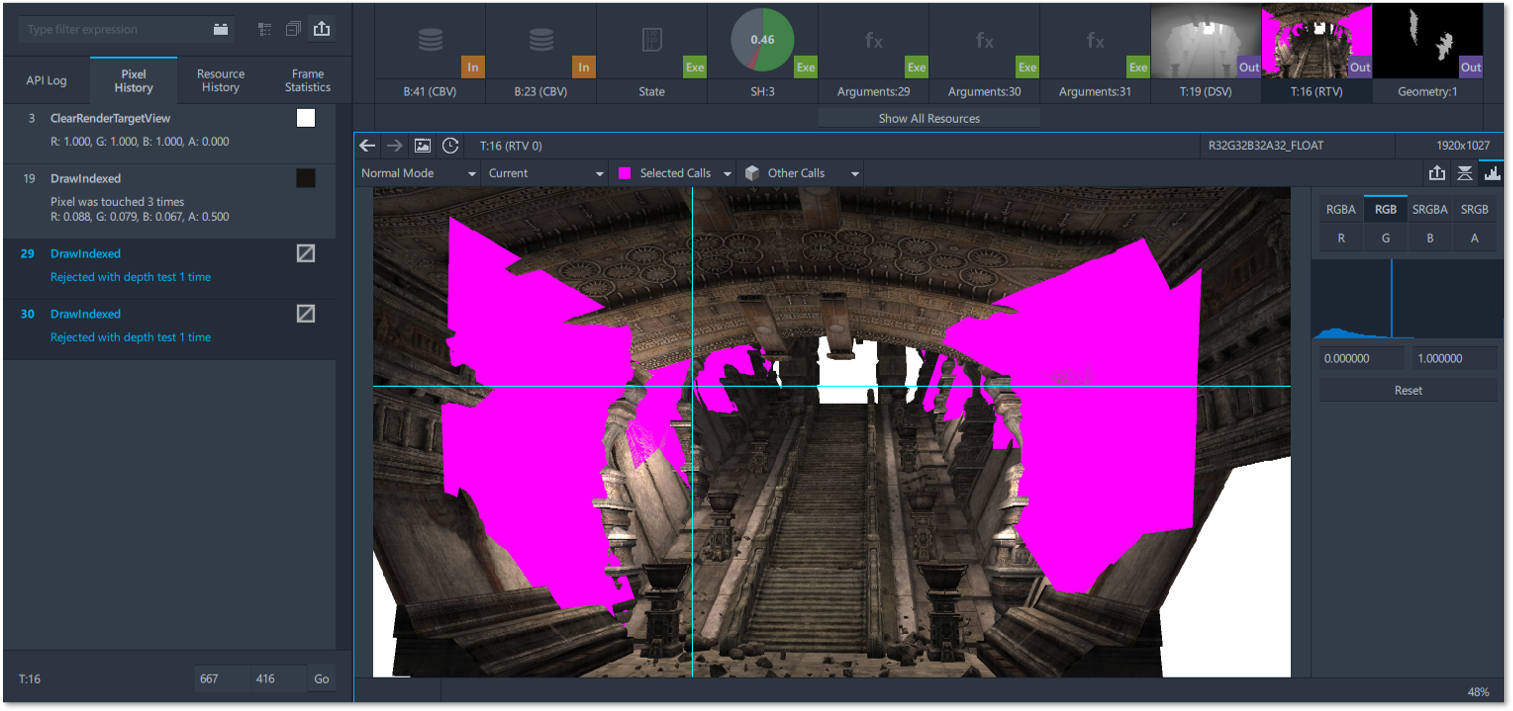
Selecting a pixel of your texture will populate the Pixel History tab of the API Log. In this tab you can view the events that affected that selected pixel and visualize colored boxes next to each call to demonstrate the color written into the frame buffer after the API calls execution. If the call had been rejected at one of the pipeline stages, the box will be white with a grey line running through it.
3D Textures, Textures with Mipmaps & Texture Arrays
For 3D textures, textures with mipmaps and texture arrays you can select a sub-resource in the MIP-level selector or Layer selector. It’s important to mention that grayed out vales in the MIP-level selector or Layer selector mean that the corresponding sub-resources do not address or use these levels in the selected resource view. For cub map textures you can open one face of a cube map by selecting from the down-down list and selecting the desired face. The default option is a cube map layout.
Buffer Viewer
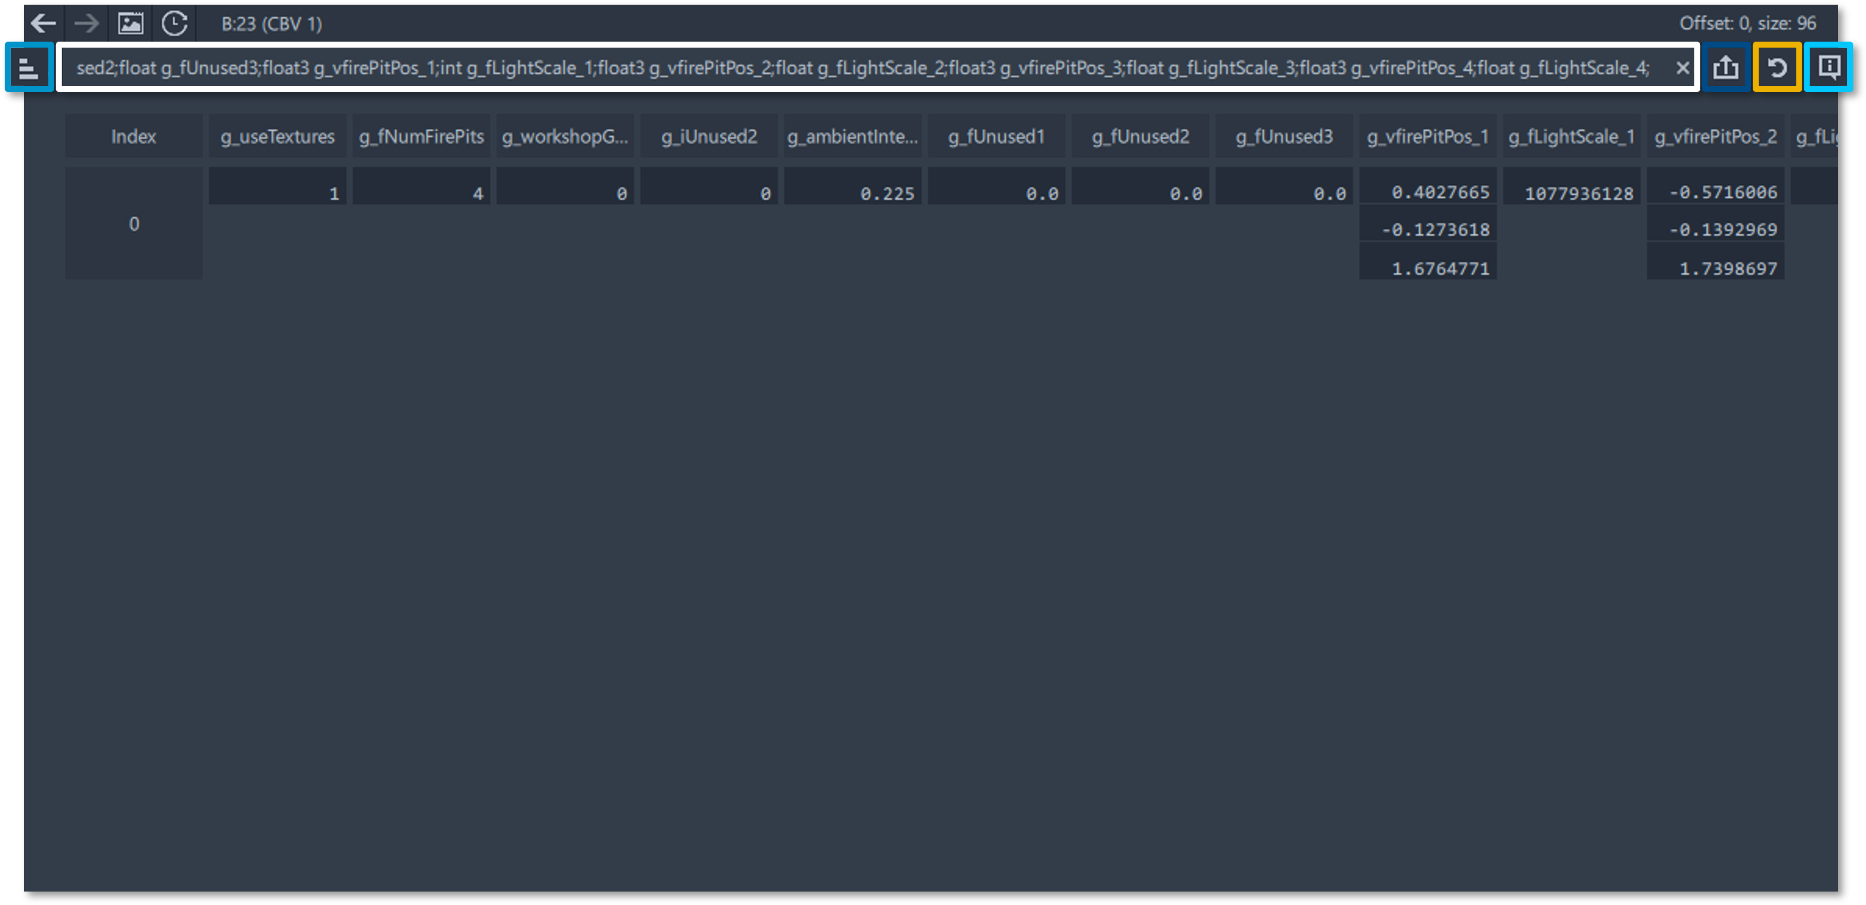
Selecting a buffer from your resource list will open the buffer viewer, displaying a detailed table or list of your buffer data. Pressing the View button will allow you toggle between list and table view of the buffer viewer. Clicking on the Layout Field next to this button will allow you to view and edit the opened buffer layout, written in buffer markup language. Pressing the Restore Default Layout button will allow you to revert any layout changes made and restores the default shader-defined, pipeline-state defined or default buffer-layout format if the buffer layout was not received from the shader. Pressing the Info button will display detailed buffer markup language information to aid in making layout changes using the layout field where layouts are extracted from a shader automatically if possible.
Shader Set Viewer
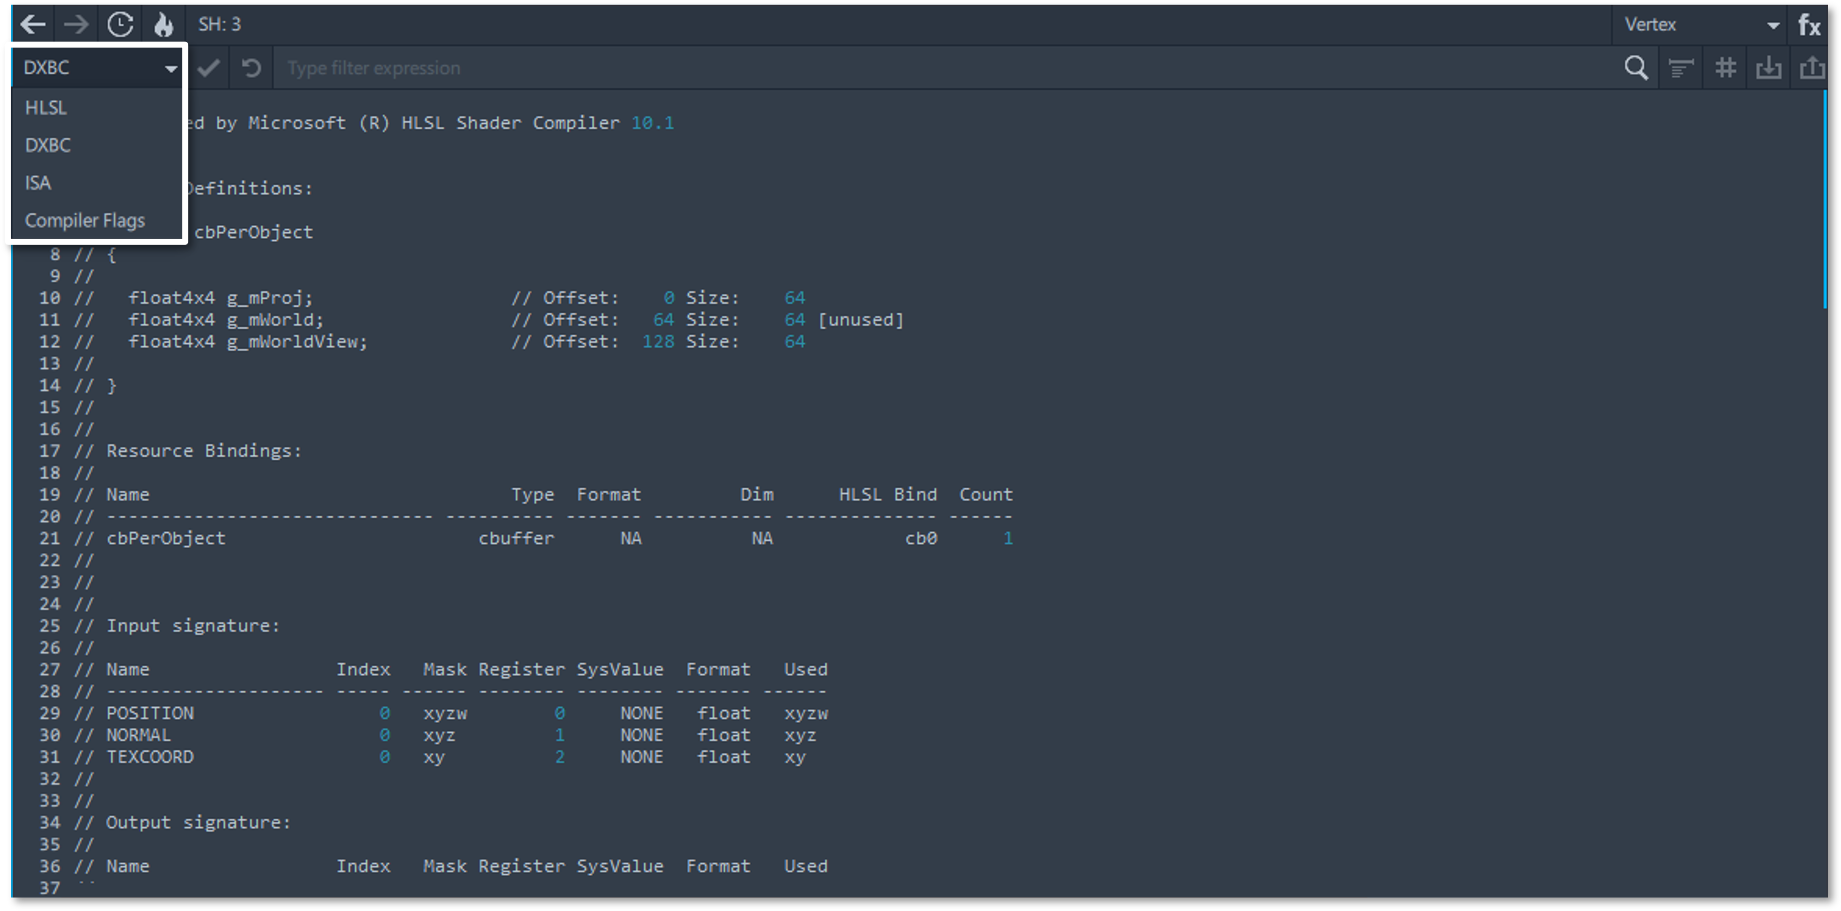
Selecting a shader set from your resource list will open the shader set viewer. In this panel you can view and modify the code from your shaders by selecting a shader from the Shader Code drop-down menu and selecting one of the following options:
- HLSL/GLSL: HLSL source code from Microsoft* DirectX or Vulkan* applications or GLSL source code for Vulkan or OpenGL* applications.
- DXBC: Assembly code.
- ISA: Assembly code for Intel® GPU’s.
- Compiler Flags: The compiler flags when compiling your shaders directly in Graphics Frame Analyzer.
Shader Editor
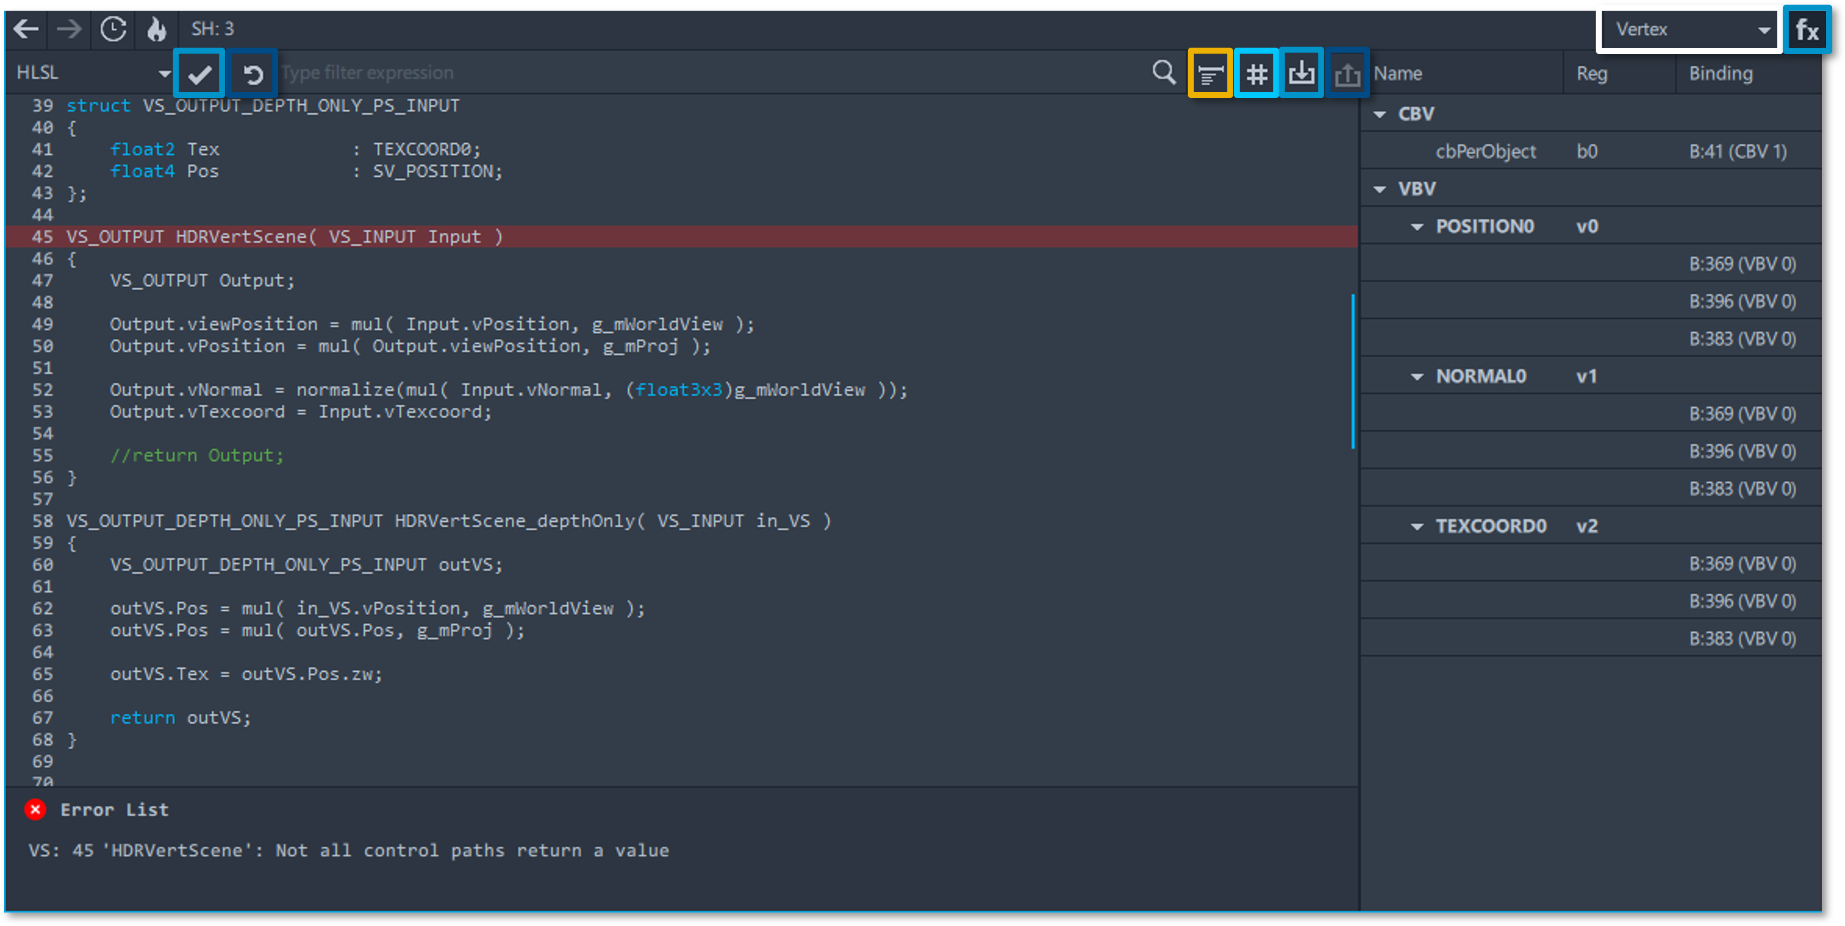
Once you have selected the shader you want to modify, the Shader Editor opens, allowing you to modify the code directly in Graphics Frame Analyzer.
NOTE: Only HLSL and GLSL source code can be modified using the shader editor.
Press the Format button to indent your code and the Preprocess button to preprocess the selected shader and hide code paths that do not get executed. Pressing the Load source code button will allow you to add your source code directly to Graphics Frame Analyzer for modifications. You can modify your frames shader code by typing directly in the shader view and the code recompiles during the process. If you have encountered any errors while editing the code, the corresponding error message can be seen in the Notifications pane below the Shader Editor. If your code is free of errors, you can press the check mark ✓ icon to save your changes and Graphics Frame Analyzer will then recalculate all metrics and display new data in the Metrics pane and in the Main Bar chart.
To display the Shader Resource List which allows you to analyze the resources used in the shaders, grouped by type, click on the Bindings button. You can view either the Pixel or Vertex shaders by selecting from the drop-down menu next to the Bindings button. In the Shader Resource list, you can view the shaders name, the shaders registers, and the resource bindings. To open a resource, click on the resource binding.
Shader Profiler
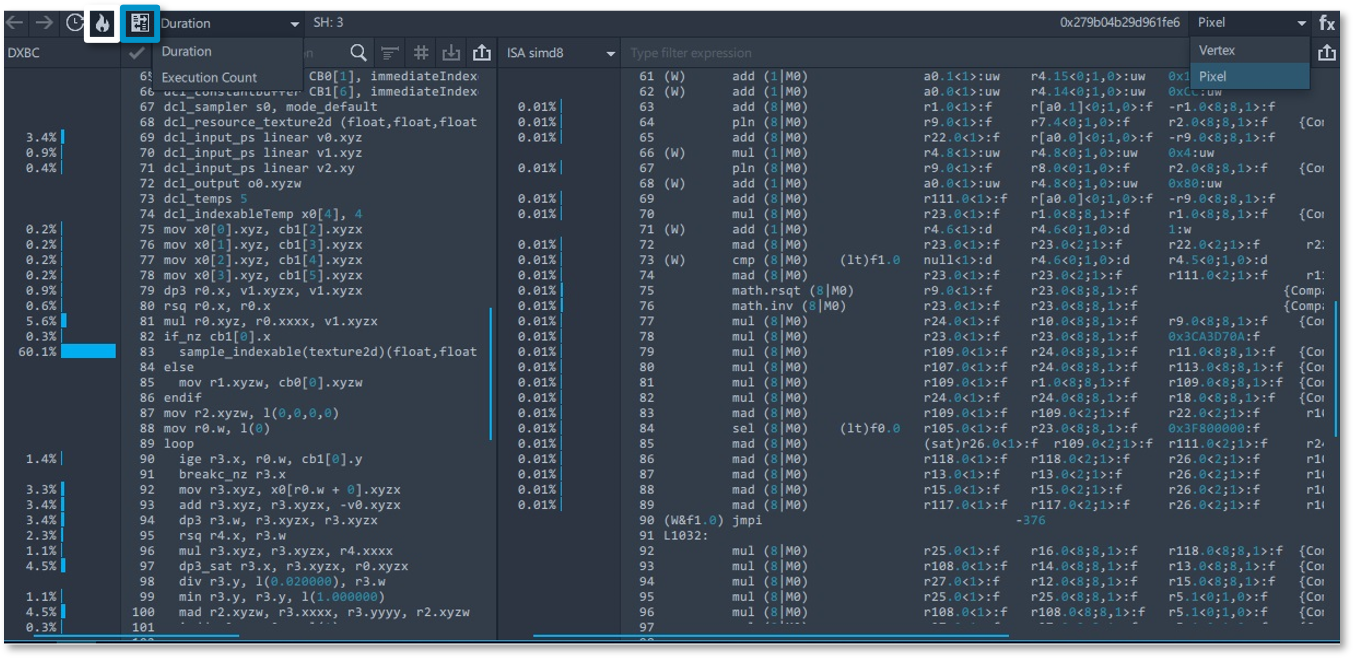
For enhanced profiling of your shaders, you can use the shader profiler feature by clicking on the Hotspot button in the shader view notated by a flame 🔥 icon.
NOTE: If you want to profile HLSL or GLSL source code you must compile your shader with debug information, for DirectX applications you can use the D3DCOMPILE_DEBUG flag.
You can select either a Pixel or Vertex shader for profiling and a list of SIMD versions used during rendering are displayed after pressing the Show Source-Assembly Mapping button. Choose a SIMD version to view GEN ISA code with profiling information, then select either Duration or Execution Count from the drop-down menu to further analyze the efficiency of your shaders.
Geometry Viewer
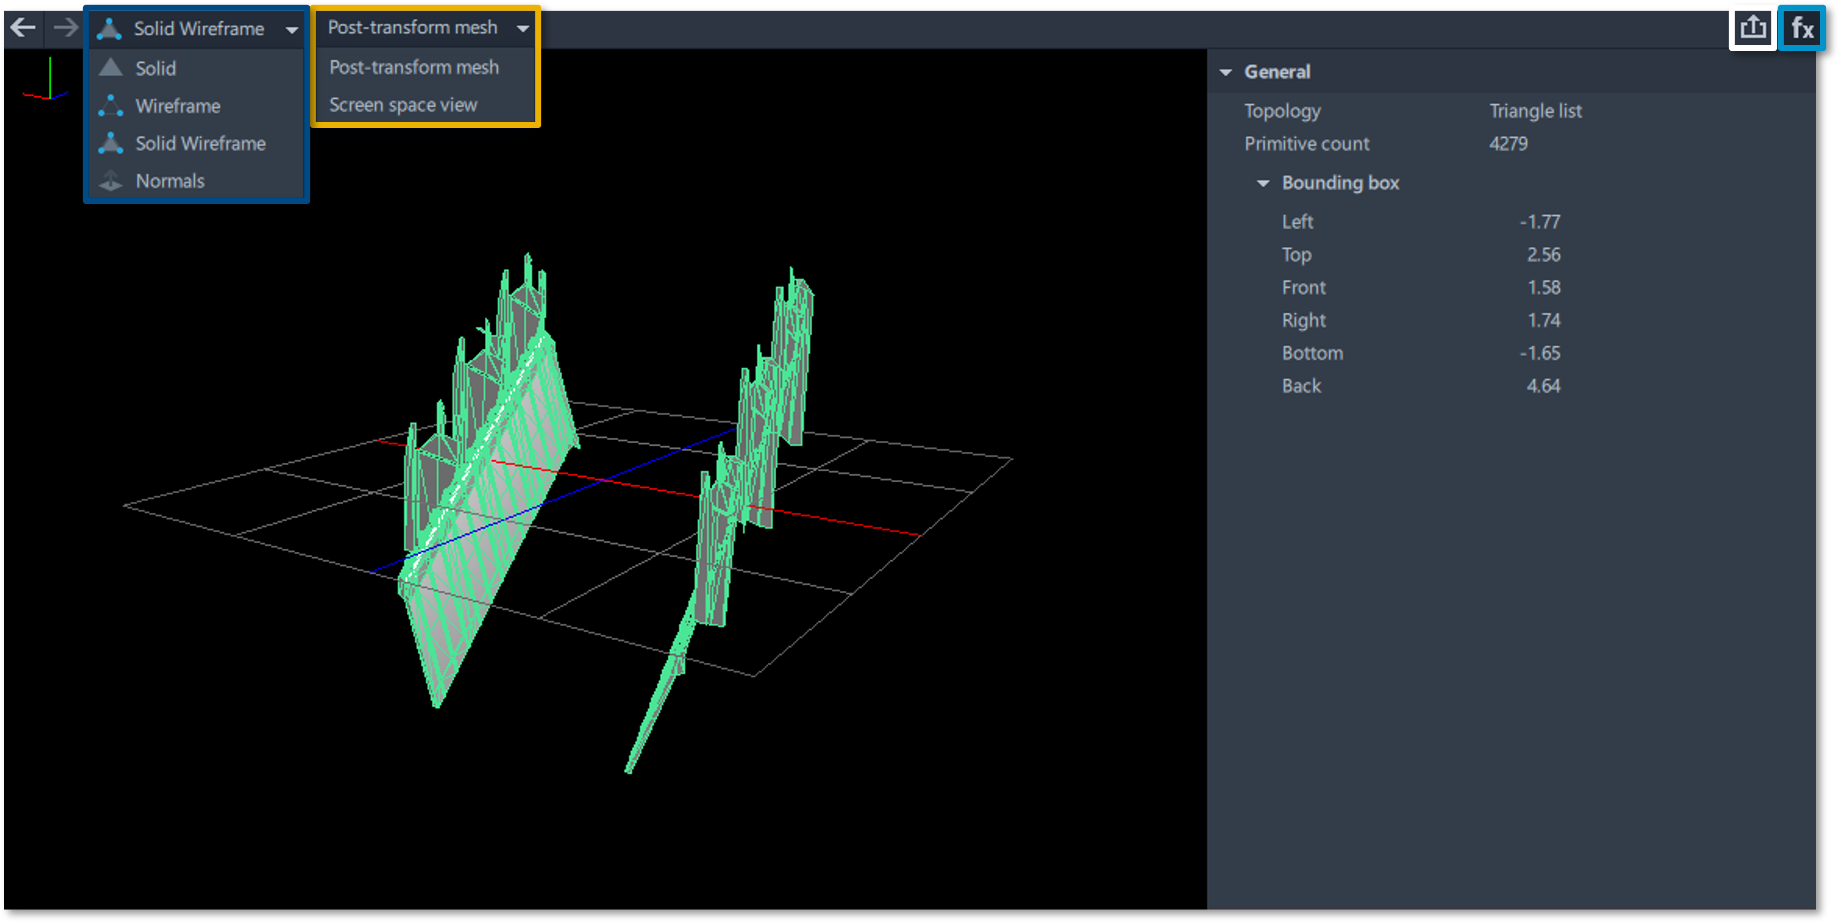
Selecting a Geometry resource from your resource list will allow you to visualize the mesh for the selected draw call. There are two different drop-down menus’ in the Geometry Viewer including the following:
- Visualization Mode: This drop-down menu allows you to switch between viewing modes to analyze the geometry aspects of your selected geometry. You can set your geometry model to any of the four options.
- Solid: Displays the object as a solid model.
- Wireframe: Displays the object as a wireframe model to inspect the backside of the object and understand how dense the object mesh is.
- Solid Wireframe: Displays a wireframe model on top of the solid model.
- Normals: Displays a normal map in the object space.
- Output Geometry View: This drop-down menu allows you to switch between two modes.
- Post-Transform Mesh: Displays the object with transformed vertices.
- Screen Space View: Displays a projected object to a 2D screen space.
While inspecting your geometry object in Post-Transform Mesh mode you can rotate the object in any direction by holding down your left mouse button. To move your geometry object within the screen space, right-click on the geometry object. To flip the axes, middle click on the on the geometry object.
You can export your geometry data in Wavefront OBJ format by clicking on the Save Geometry to File button. You can click on the Geometry Layout button to display details of your geometry, including general information like topology and bounding boxes as well as attached vertex buffers and their layouts.
Sampler Viewer
Selecting a Sampler resource from your resource list will display a table of read only settings for your sampling textures. To the left of this table you can view all the samplers in your selected draw call and navigate through them.

Arguments Viewer
Selecting an Argument from your resource list will display the list of arguments of the selected graphics API function as well as the data associated with that function.
NOTE: The Arguments viewer only shows data for a single function.

States Viewer
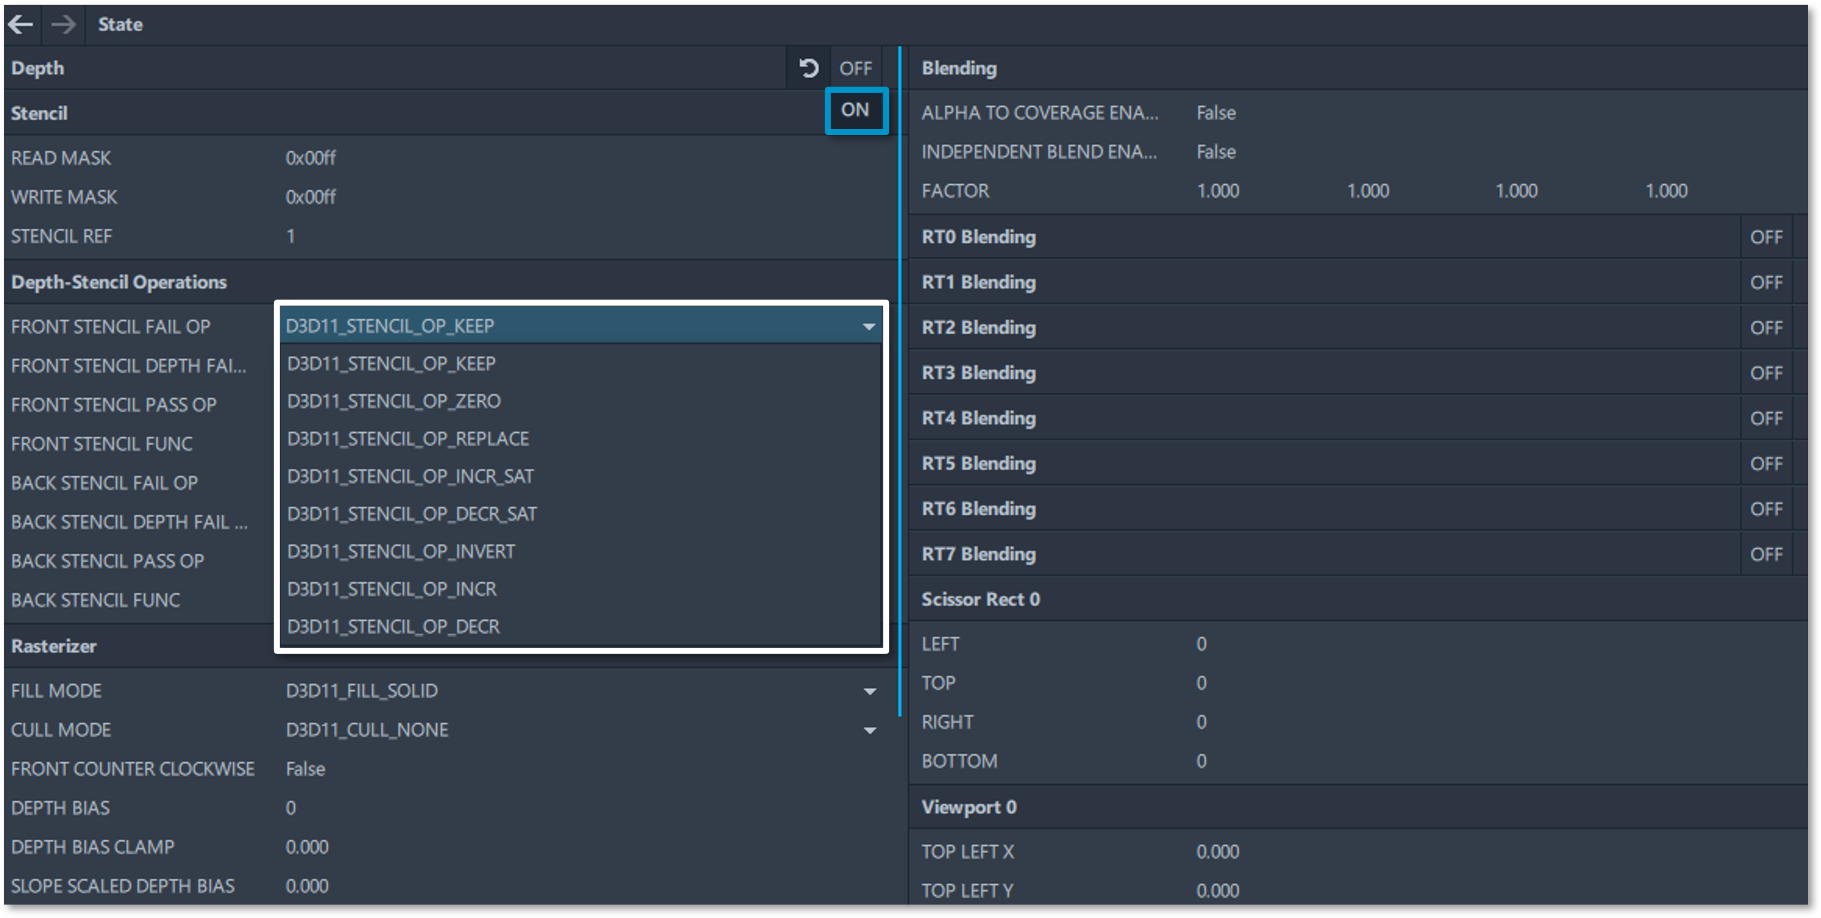
Selecting a State resource will display the Graphics Pipeline or Compute Pipeline viewer, showing settings for fixed function blocks of the graphics or compute pipeline. You can press the toggle button to turn groups of data on or off. For DirectX and OpenGL applications, the State viewer displays API-agnostic data which can be modified for several draw calls simultaneously. Settings with a down arrow next to them can be modified by clicking on that setting and selecting from the drop-down menu that pops up underneath it.
Root Signatures and Descriptors
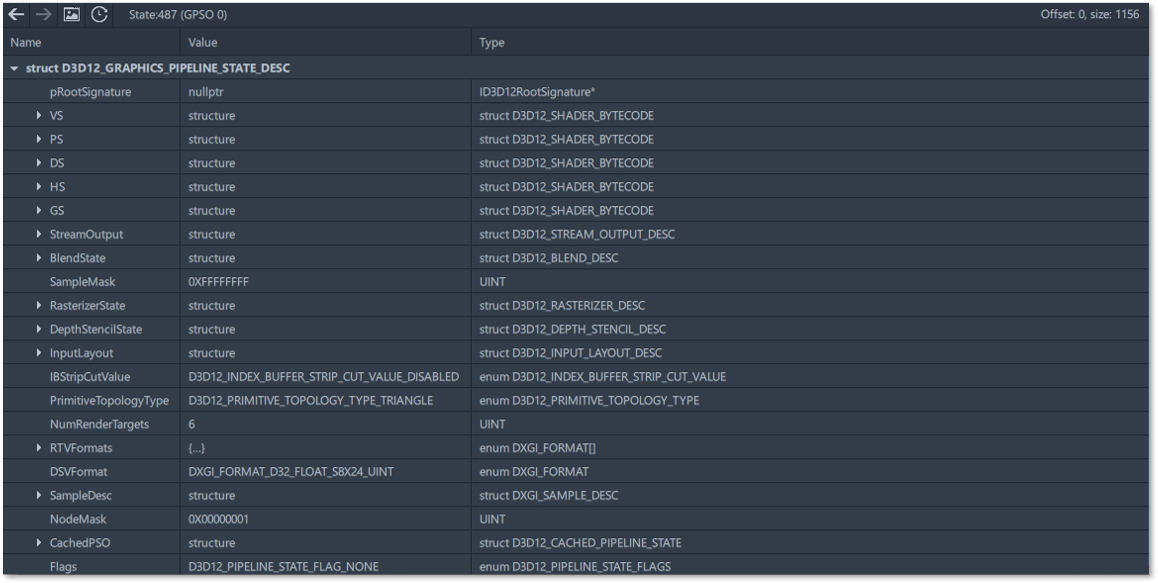
If your application uses Microsoft* DirectX 12 or Vulkan* you can explore the internals of DirectX 12 Root Signatures or Vulkan Descriptor Sets, which are useful for debugging.
Useful User Interface Features
There are a few more user interface features that are worth mentioning while inspecting resources using the resource viewer, including the following buttons:
- Previous: Open the previous selected resource.
- Next: Open the next selected resource.
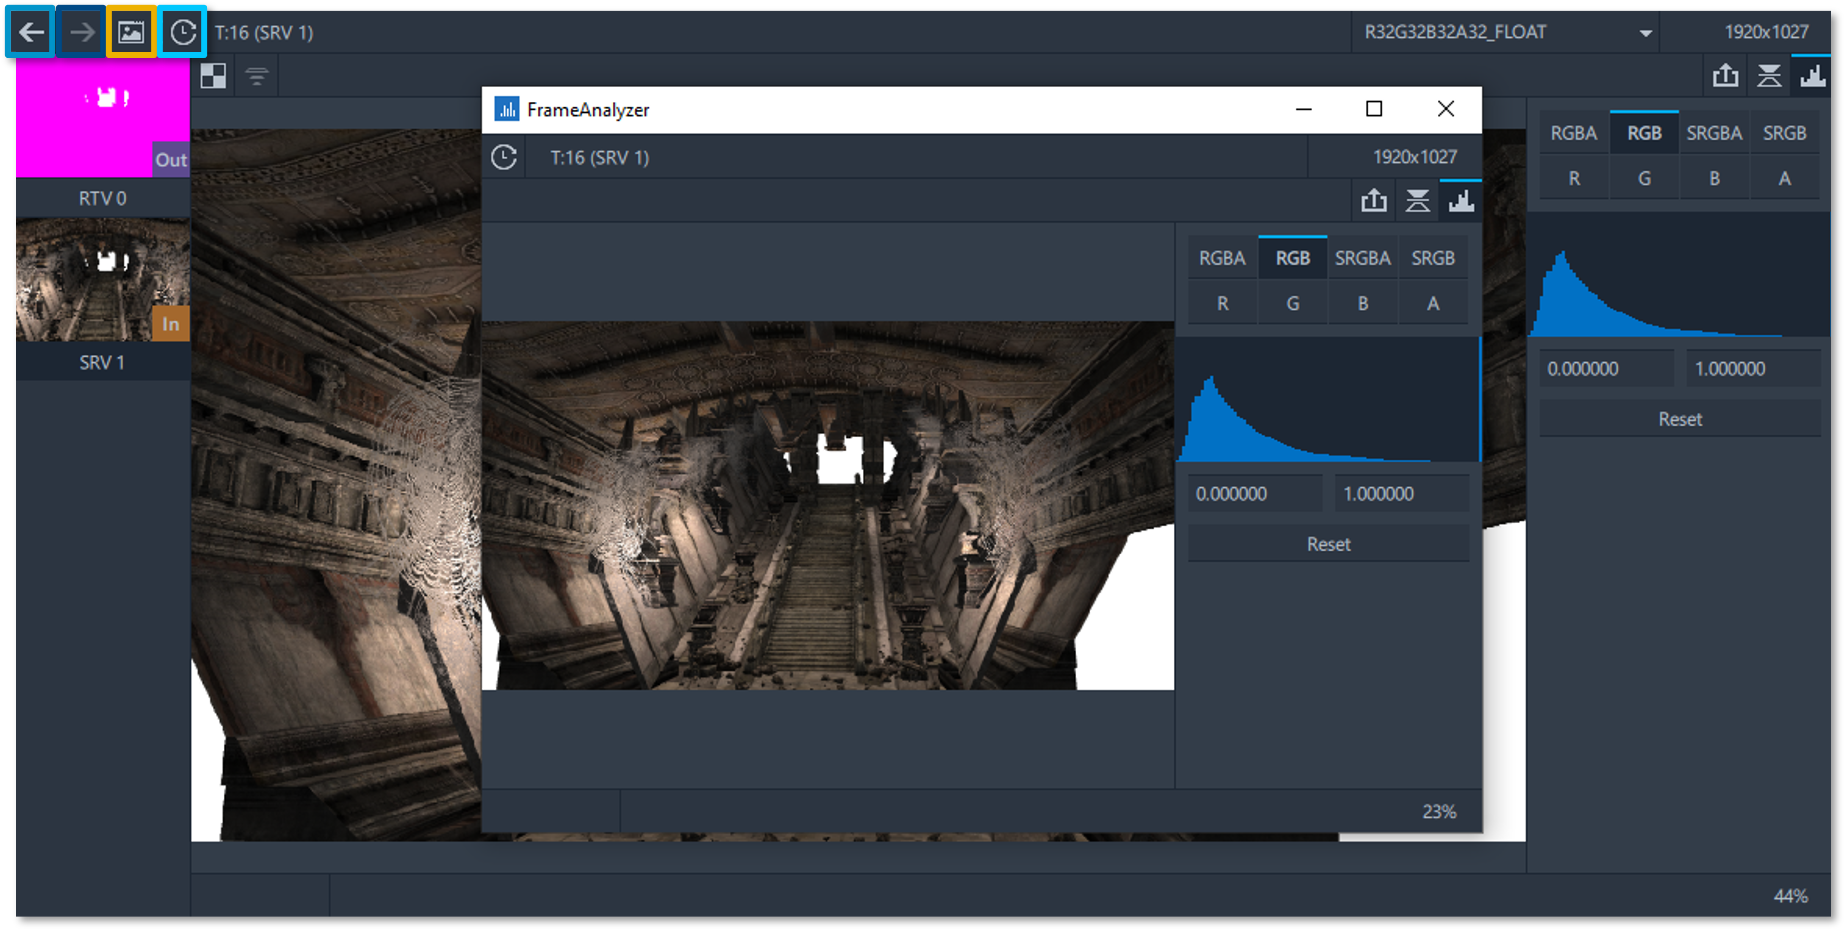
- Show Resource in Separate Window: Display the resource viewer in a separate window.
- Resource History: Populate the Resource History tab of the API Log pane to display the events that were used in the selected resource.
Conclusion
This article demonstrated how to use the center panel of the tool to inspect a draw call further while analyzing a single frame in Graphics Frame Analyzer. For more information on how to identify and analyze problem areas in your applications to resolve GPU performance regressions continue reading the Graphics Frame Analyzer Deep Dive articles.
Additional Resources
Part 1: Configure and Capture Frames (Article)
Part 2: Configure and Capture Multiple Frames (Article)
Part 3: Open and Explore Multiple Frames (Article)
Part 4: Open and Explore a Single Frame (Article)
Part 5: Working with the Bar Chart and API Log (Article)
Part 6: Exploring the Metrics Viewer (Article)
Part 7: Inspecting a Draw Call (Video)