Introduction
Intel® Graphics Performance Analyzers (GPA) offers a wide range of tools to analyze graphics applications across diverse workloads, platforms, and graphics APIs. Within Intel® GPA you can use Graphics Frame Analyzer to identify and analyze problem areas in your applications to resolve GPU performance regressions. This article will demonstrate how to use the metrics viewer while analyzing a single frame in Graphics Frame Analyzer to determine bottlenecks and performance regressions in your applications. Topics covered in this article can be visualized in video format in the Exploring the Metrics Viewer Deep Dive video, by checking reference markers in the images associated with this article.
Pre-requisites
Before proceeding with this article, ensure you have the minimum system requirements to successfully analyze graphics applications using Intel® GPA. Also make sure you have downloaded and installed Intel® GPA on your host platform.
Metrics Viewer
While a single frame is open in Graphics Frame Analyzer, select events you want to analyze further either in the Bar Chart or API Log of the tool. In the metrics panel of the right side of the tool you can analyze metric information for the selected evets. If nothing is selected the only total values for the entire frame are displayed in this panel.
Full Frame and Current Selection Tabs
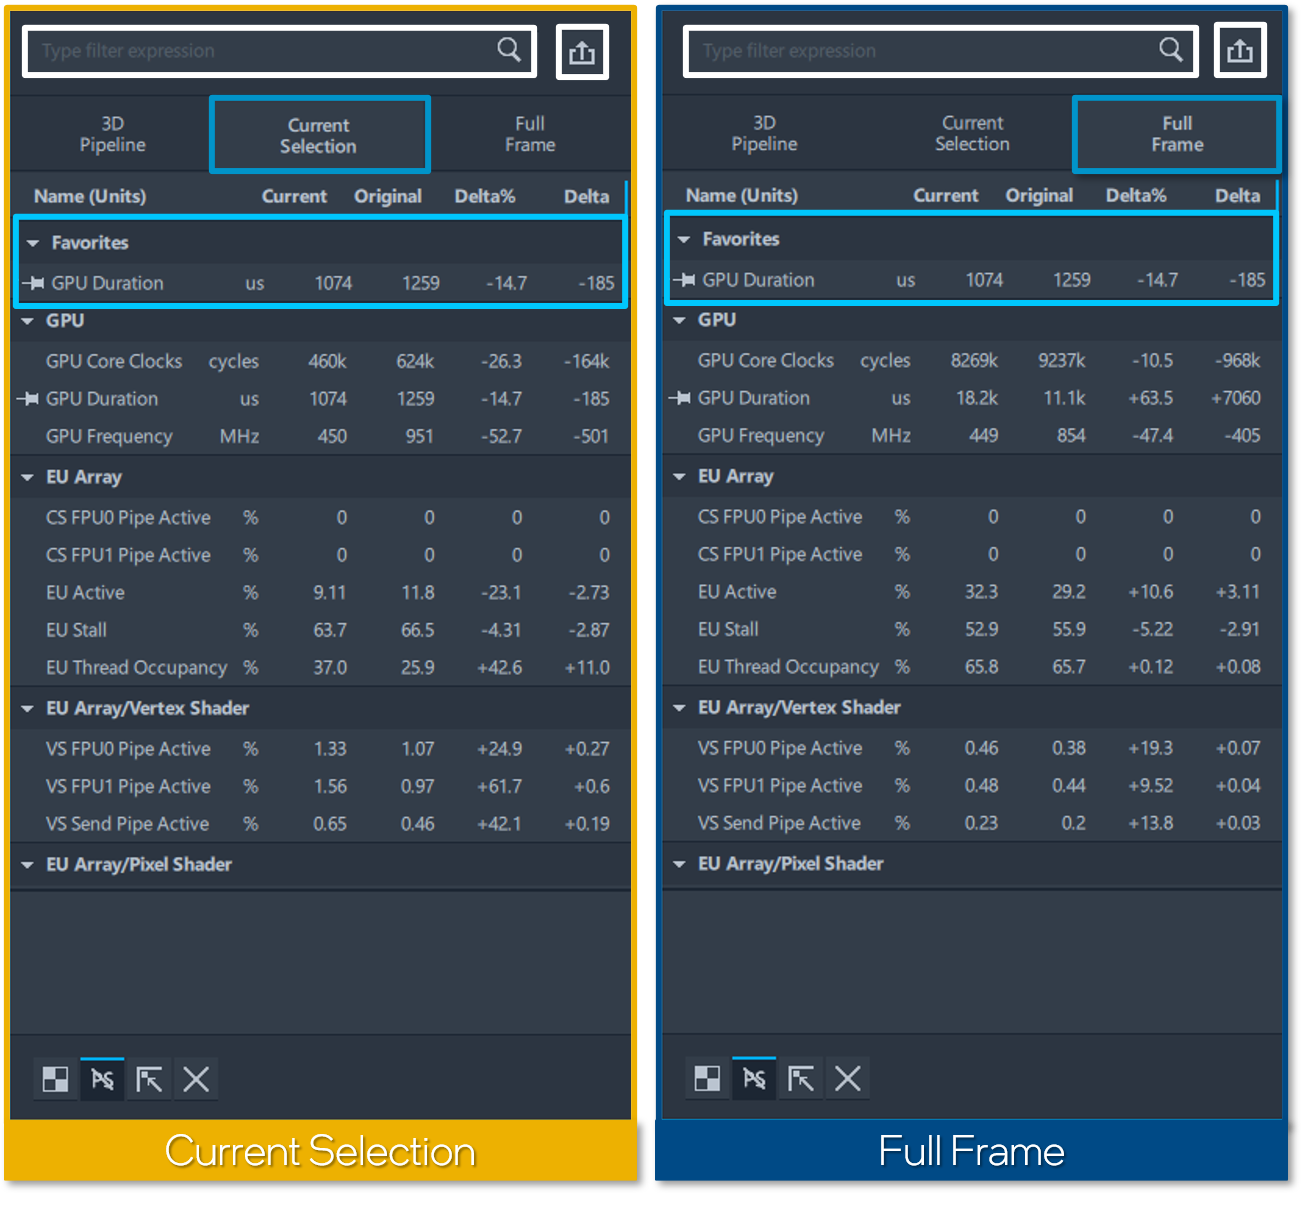
In the Full Frame tab, you can view real time metrics for the entire frame, grouped together into categories. Alternatively, in the Current Selection tab you can view real time metrics based on the calls you currently have selected in the Bar Chart and API Log.
Both of these tabs contain a table consisting of the metrics name, the unit that metric is measured in, the current data for the metric after render state experiments have been applied, the original data and the change in unit or percentage between the current and original data, which can be viewed by toggling between modes or expanding the metrics panel. Each of the metrics in this table are categorized and you can collapse or expand metrics based on the category by clicking on the category name.
Hovering over a metric will display a pin 📌 icon to the left of metrics name. Clicking on that pin icon will create a new category called Favorites, add the metric to your favorites category and display your favorite metrics at the top of the table for easy access. Clicking on a metric will display the metrics description at the bottom of the metrics panel. At the top of the metrics panel you can click on the Filter Expression Field, type in a metric you want to search for and all other results will be filtered out and only the metric or category with your keyword in it will be displayed. Press the Export Metric Values button to export your metrics data into a CSV file on your computer.

3D Pipeline and Compute Pipeline Tabs
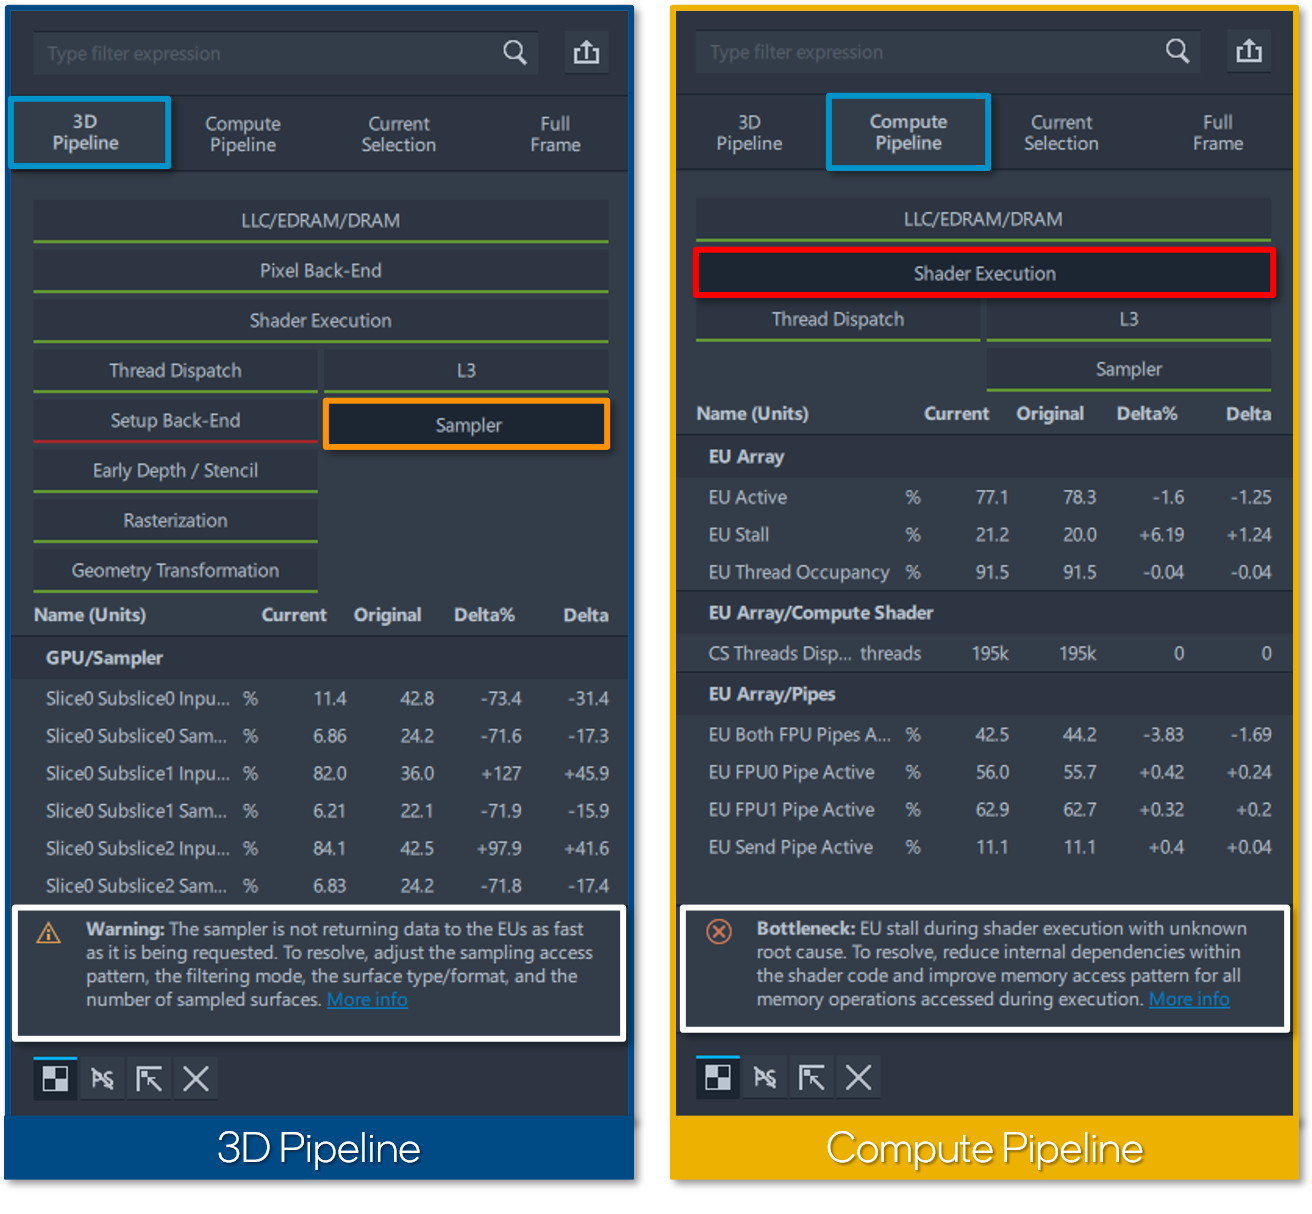
In the 3D Pipeline tab you can view detailed metric information on your selected events for each bottleneck type. The colored underlines, underneath each of these bottleneck types have different meanings dependent on the color. A red underline denotes a block with a primary bottleneck for the current selection or the entire frame if nothing is selecting, meaning that this is a primary factor limiting the performance of your application and any changes made to other areas will not aid in performance until this bottleneck is resolved. An orange underline denotes a block with a potential bottleneck and will likely be bottlenecked after the primary bottleneck is resolved. A green underline denotes a block that is not bottlenecked.
Clicking on each of these stages will display metric information that’s relevant to that specific stage in the pipeline. If the selected stage is causing a primary or potential bottleneck a description will pop up upon selection, displaying the words bottleneck ⨂ or warning ⚠️, notated by different icons. Graphics Frame Analyzer will describe where your application is bottlenecking as well as potential solutions to resolve that bottleneck. Clicking on the More Info button will direct you to detailed documentation on how to optimize your application to increase performance in that stage of the pipeline
If your application uses dispatch calls and your hardware supports a full set of Intel® metrics, then you can view the Compute Pipeline, displaying each bottleneck type in the compute pipeline with metrics associated with those bottleneck types.

Conclusion
This article demonstrated how to use the metrics viewer to locate bottlenecks and performance regression in your applications while analyzing a single frame in Graphics Frame Analyzer. For more information on how to identify and analyze problem areas in your applications to resolve GPU performance regressions continue reading the Graphics Frame Analyzer Deep Dive articles.
Additional Resources
Part 1: Configure and Capture Frames (Article)
Part 2: Configure and Capture Multiple Frames (Article)
Part 3: Open and Explore Multiple Frames (Article)
Part 4: Open and Explore a Single Frame (Article)
Part 5: Working with the Bar Chart and API Log (Article)
Part 6: Exploring the Metrics Viewer (Video)
Part 7: Inspecting a Draw Call (Article)
Part 8: Render State Experiments (Article)
Intel® Graphics Performance Analyzer Cookbook