Overview
In this tutorial, learn how to build a Smart Meter Scanning application using the OpenVINO™ toolkit by following the Jupyter* Notebook. See actual benchmark data and be able to perform real-world benchmarks on your own setup.
With the OpenVINO toolkit, you can develop an AI-based application for digitally reading industrial meters by using object detection, OCR for digital meters, and segmentation for pointer-type meters. The OpenVINO toolkit minimizes the time it takes to process input data to produce a prediction as an output. Decision-making is faster, while your system interactions are more efficient. This enables the use of computer vision to read meters, minimize errors, and attain a higher degree of accuracy.
In areas like energy usage, manual inspection of analog meters is inaccurate, while upgrading to digital meters can be costly. Real-time data from this application allows companies to proactively identify areas for improvement and safety, and even detect potential equipment malfunctions through anomalous usage patterns.
Furthermore, this solution can be applied to anything involving the transformation of analog data into digital through object detection and segmentation.
Prerequisites
- Python* 3.7 or later installed on your system.
- Supported hardware that aligns with the OpenVINO toolkit system requirements.
Step 1: Clone the Repository
To clone the Smart Meter Scanning repository to your system, use the following command:
git clone -b recipes https://github.com/openvinotoolkit/openvino_notebooks.git
This clones the repository into the folder, openvino_notebooks. Next, navigate to the folder:
cd openvino_notebooks/recipes/meter_reader
This application uses Python to set up a virtual environment for this project. If you do not have the virtual environment package installed, run the following:
sudo apt-get update
sudo apt-get upgrade
sudo apt-get install python3-ven
If you have a CPU with an integrated graphics card from Intel, to enable inference on this device, install the Intel® Graphics Compute Runtime for oneAPI Level Zero and OpenCL™ Driver. The command for Ubuntu* 20.04 is:
sudo apt-get install intel-opencl-icd
Next, prepare your virtual environment.
Step 2: Create and Activate a Virtual Environment
To avoid affecting things globally on your system, it is a best practice to isolate a Python project in its own environment. To set up a virtual environment, open the terminal or command prompt and navigate to the directory where you want to establish the environment. Then, run the following command to create a new virtual environment:
For UNIX*-based operating systems like Linux* or macOS*, use:
python3 -m venv venv
For Windows*, use:
python -m venv venv
This creates a new virtual environment, venv, in the current folder. Next, activate the environment you just created. The command used depends on your operating system.
For UNIX-based operating systems like Linux or macOS, use:
source venv/bin/activate
For Windows, use:
venv\Scripts\activate
This activates the virtual environment and changes your shell's prompt to indicate as such.
Step 3: Install the Requirements
The Smart Meter Scanning application has a number of dependencies that must be installed in order to run. These are listed in the included requirements file, and can be installed using the Python package installer.
To install the required Python libraries, including the OpenVINO toolkit, use the following command:
python -m pip install --upgrade pip

pip install -r requirements.txt
All dependencies and requirements are now installed. Next, you will prepare the models and configure the application.
Step 4: Prepare the Models
The models for a meter reader solution include detection and segmentation models. They can be created with any AI training framework, such as PyTorch* or TensorFlow*. In this example, to download pretrained models from PaddlePaddle*, use the following command:
cd model

sudo sh ./download_pdmodel.sh
Step 5: Configure the Smart Meter Scanning Application
This project’s test image contains different types of industrial meters, and the parameters of these meters need to be predefined to calculate the final readings. These parameters include the meter’s range, scale interval values, and units, and can be configured like the following:
"meter_config": [

 {

 "scale_interval_value": 0.5,

 "range": 25.0,

 "unit": "(MPa)"

 },

 {

 "scale_interval_value": 0.05,

 "range": 1.6,

 "unit": "(MPa)"

 }

	],
Besides the configuration on meters, the parameter of the model is defined as well, including path of model file, input shape, normalization parameter, and color format. These parameters are implemented in the preprocessing step of each model:
"model_config": {

 "detector": {

 "model_path": "./model/meter_det_model/model.pdmodel",

 "device": "CPU",

 "input_shape": 608,

 "model_shape": {"image": [1, 3, 608, 608], "im_shape": [1, 2], "scale_factor": [1, 2]},

 "scale": 255,

 "color_format": "bgr",

 "mean": [

 0.485,

 0.456,

 0.406

 ],

 "std": [

 0.229,

 0.224,

 0.225

 ]

 },

 "segmenter": {

 "model_path": "./model/meter_seg_model/model.pdmodel",

 "device": "CPU",

 "batch_size": 2,

 "input_shape": 512,

 "model_shape": {"image": [-1, 3, 512, 512]},

 "scale": 255,

 "color_format": "bgr",

  "mean": [

 0.5,

 0.5,

 0.5

 ],

 "std": [

 0.5,

 0.5,

 0.5

 ]

 }

 }
These can be found in the folder, config/config.json. For other scenarios with different meters and models, these values need to be adjusted accordingly.
Step 6: Understand Preprocessing and Postprocessing
Analog meter reading can be broken up into preprocessing, which involves image formatting for meter detection and segmentation, and postprocessing, which processes the data to output the final meter reading.
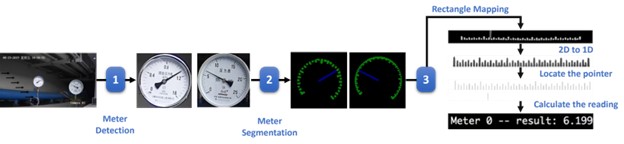
The application starts by preprocessing the images. This process includes layout transposing, normalization, and resizing the images to match the input requirements of the model. This image is then ready for use with an object detection model, with the goal of detecting all the meters in the image.
def detect(self, input):

 # Prepare the input data for meter detection model

 im_shape = np.array([[self.input_shape, self.input_shape]]).astype('float32')

 scale_factor = np.array([[1, 2]]).astype('float32')

 input_image = self.det_preprocess(input, self.input_shape)

 inputs_dict = {'image': input_image, "im_shape": im_shape, "scale_factor": scale_factor}

 # Run meter detection model

 det_results = self.det_compiled_model(inputs_dict)[self.det_output_layer]

 # Filter out the bounding box with low confidence

 filtered_results = self.filter_bboxes(det_results, self.score_threshold)

 # Prepare the input data for meter segmentation model

 scale_x = input.shape[1] / self.input_shape * 2

 scale_y = input.shape[0] / self.input_shape

 # Create the individual picture for each detected meter

 roi_imgs, self.loc = self.roi_crop(input, filtered_results, scale_x, scale_y)

 roi_imgs, resize_imgs = self.roi_process(roi_imgs, self.METER_SHAPE)

 # Create the pictures of detection results

 roi_stack = np.hstack(resize_imgs)

 cv2.imwrite("./data/detection_results.jpg", roi_stack)

 return roi_imgs
Detection results that are of low confidence are also filtered out, and the relevant regions of interest (ROI) are returned. These images are then cropped and further processed for segmentation.
def roi_crop(image, results, scale_x, scale_y):

 roi_imgs = []

 loc = []

 for result in results:

 bbox = result[2:]

 xmin, ymin, xmax, ymax = [int(bbox[0] * scale_x), int(bbox[1] * scale_y), int(bbox[2] * scale_x), int(bbox[3] * scale_y)]

 sub_img = image[ymin:(ymax + 1), xmin:(xmax + 1), :]

 roi_imgs.append(sub_img)

 loc.append([xmin, ymin, xmax, ymax])

 return roi_imgs, loc
In this case, the number of meters potentially detected in a photo is arbitrary, meaning the input shape of the segmentation model may vary in batch size dimension. This is called a dynamic shape. There are several approaches to handle arbitrarily sized inputs such as padding, model reshape, and multiple precompiled models.
One of the advantages offered by the OpenVINO toolkit is that it allows for loading data directly with dynamic shape to the OpenVINO runtime. If the maximum number of the meters in the picture can be predicted, it is highly recommended to set the input data size upper-bound via ranged dimension, which provides better inference performance due to the lower memory consumption.
def segment(self, input):

 seg_results = list()

 num_imgs = len(input)

 image_list = list()

 # Run meter segmentation model on all detected meters

 for i in range(0, num_imgs, self.seg_batch_size):

 batch = input[i : min(num_imgs, i + self.seg_batch_size)]

 seg_result = self.seg_compiled_model({"image": np.array(batch)})[self.seg_output_layer]

 seg_results.extend(seg_result)

 results = []

 for i in range(len(seg_results)):

 results.append(np.argmax(seg_results[i], axis=0))

 seg_results = self.erode(results, self.erode_kernel)

 # Create the pictures of segmentation results

 for i in range(len(seg_results)):

  image_list.append(self.segmentation_map_to_image(

	 seg_results[i], self.COLORMAP))

 # Create the pictures of segmentation results

 mask_stack = np.hstack(image_list)

 cv2.imwrite("./data/segmentation_results.jpg", cv2.cvtColor(mask_stack, cv2.COLOR_RGB2BGR))

 return seg_results
After segmentation, preprocessing is complete and the results can be fed into postprocessing. With the meters detected and segmented, the final meter readings must be processed and returned. This includes binarization of the scales and pointers to calculate pointer location in a scale map to return a final meter reading.
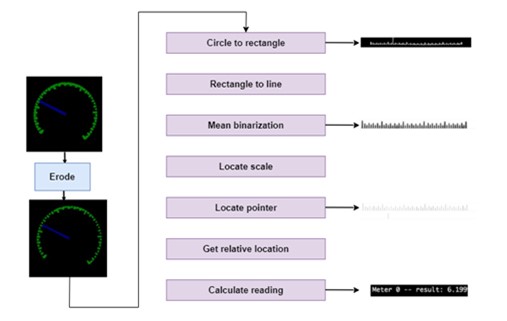
def postprocess(self, input):

 # Find the pointer location in scale map and calculate the meters reading

 rectangle_meters = self.circle_to_rectangle(input)

 line_scales, line_pointers = self.rectangle_to_line(rectangle_meters)

 binaried_scales = self.mean_binarization(line_scales)

 binaried_pointers = self.mean_binarization(line_pointers)

 scale_locations = self.locate_scale(binaried_scales)

 pointer_locations = self.locate_pointer(binaried_pointers)

 pointed_scales = self.get_relative_location(scale_locations, pointer_locations)

 meter_readings = self.calculate_reading(pointed_scales)
The pipeline for post-processing can also be visualized as follows:
Step 7: Run the Smart Meter Scanning Application
With an understanding of preprocessing and postprocessing, you can now run the application and obtain a final meter reading.
To load and compile the deep learning models for meter detection and meter segmentation, use the following code:
# Loading and compiling for meter detection:

self.det_model = ie_core.read_model(det_model_path)

self.det_model.reshape(det_model_shape)

self.det_compiled_model = ie_core.compile_model(

model=self.det_model, device_name=self.config["model_config"]

	["detector"]["device"])

self.det_output_layer = self.det_compiled_model.output(0)


# Loading and compiling for meter segmentation:

 self.seg_model = ie_core.read_model(seg_model_path)

self.seg_model.reshape(seg_model_shape)

self.seg_compiled_model = ie_core.compile_model(

model=self.seg_model, device_name=self.config["model_config"]

	["segmenter"]["device"])

self.seg_output_layer = self.seg_compiled_model.output(0)
Note In the device_name for running inferencing, you can specify your preference of the device or set it to AUTO to let the OpenVINO toolkit choose the best inference device for you from your available hardware devices.
To run the application, use the following command. Make sure to replace config/config.json and data/test.jpg with the path to your configuration file and test image. The result images are exported to the same folder as the test image.
python main.py -i data/test.jpg -c config/config.json -t "analog"
The input parameters to run the application include:
- -i: The path of the input image, an image of the industrial meters captured by a live camera
- -c: The path of the configuration file, which includes the parameters for model inference, preprocess and postprocess steps.
- -t: Choose from analog and digital to implement automatic meter reading for analog or digital industrial meters.
With this, you have obtained your meter readings.
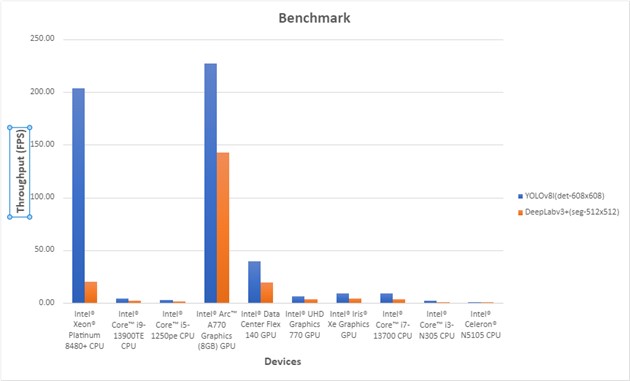
Step 8: Performance Benchmark with Benchmark_App
To evaluate the performance of models in meter reader pipeline, use the OpenVINO toolkit Benchmark_App. This step provides insight into the model's real-world performance, allowing you to plan for deployment.
The new, trained YOLO* v8l model that uses the Ultralytics framework is recommended. (PPYOLO v2 currently is not supported by GPUs.) You can download it from this repository in GitHub*.
To run this application with YOLO v8l pipeline, switch the default configuration file to ./config/yolov8.json using the following command:
python main.py -i data/test.jpg -c config/yolov8.json

  -t "analog"
To run the Benchmark_App in the Intel® Developer Cloud or on your local machine, refer to following examples:
!python benchmark_app -m ./model/yolov8.onnx \

	 -shape [1, 3, 608, 608] \

            -d $DEVICE \

            -niter 50 \

            -hint $PERF_HINT \

            --report_type detailed_counters \

            --report_folder ${SAMPLEPATH}/${OUTPUT_FILE}/${JOB_ID}


!python benchmark_app -m ./model/deeplabv3+.onnx \

	 -shape [1, 3, 512, 512] \

            -d $DEVICE \

            -niter 50 \

            -hint $PERF_HINT \

            --report_type detailed_counters \

            --report_folder ${SAMPLEPATH}/${OUTPUT_FILE}/${JOB_ID}
Here, performance of YOLO v8l trained in the Ultralytics pipeline was tested for meter detection, and performance of DeepLabv3+ trained in PyTorch framework was tested for meter segmentation.
Conclusion
You have learned how to use OpenVINO to create a Smart Meter Scanning application that uses computer vision for object detection and segmentation to read analog industrial meters. This provides a reliable, scalable alternative to manual detection that improves accuracy, time efficiency, and security.
In any industry that relies on analog meters like energy or manufacturing, there are a large number of meters that require constant inspection readings to ensure sustained operation and safety. These meters can come in a wide variety of types, are scattered across different physical locations, and exist in harsh working conditions.
The use of AI inference enables the creation of intelligent applications that can perform real-time analysis of visual data, to extract valuable insights and improve business operations. OpenVINO ensures this process is performant with low latency.
If you have any questions or things you would like to share, join the discussion on GitHub or the Intel Community Support Channel. To learn more about developing with the OpenVINO toolkit, see the documentation.
For more detailed information on performance benchmarks, visit GitHub.