Introduction
Ever since the Intel® Pentium® processor was introduced, hardware features have been introduced to help measure processor performance parameters and tune system performance. After decades of development and improvement, the performance-monitoring features have become important and widely used in applications, compilers, and system profiling for performance optimization and monitoring.
The performance monitoring unit (PMU) provides access to performance events and processor event-based sampling (PEBS). Performance events are captured through the counting mode and sampling mode. In counting mode, performance counters are used to count occurrences of selected performance events in specific time intervals. In sampling mode, performance counters are set to predefined initial values, and then count the occurrence of selected performance events. When a performance counter overflows, the system records the selected performance parameters with the system status, such as the instruction pointer of the instruction right after the instruction that triggered the PEBS assist.
The last branch record (LBR) facility is also an important processor feature for performance tuning and profiling. LBR records software path history used for feedback-directed optimization (FDO) in the compiler. LBR records entries that contain the source IP address, the destination IP address, and metadata of a control-flow transfer operation. The total number of entries to record is configurable. LBR could also be configured to be included within the PEBS record. This allows LBR and PEBS to be used together in sampling mode for performance profiling.
Timed PEBS (TPEBS) is one of the latest extensions on PEBS, which is supported on the Intel® Core™ Ultra processor (formerly code named Meteor Lake) and an upcoming server processor code named Granite Rapids. The TPEBS extension logs instructions that require latency in unhalted core clocks and stores it in the PEBS record. TPEBS could be used in performance metric calculations to improve result accuracy.
In addition to these new hardware features, Intel defines and publishes performance metrics to help with performance monitoring and analysis. Metrics are a way to consume the events from the PMU in a much more user-friendly way, making it easier to identify issues in your code and system. One of the published metric sets is the Top-down Microarchitecture Analysis (TMA). This methodology provides a set of metrics based on performance events. It helps find real performance bottlenecks at a microarchitecture level for applications to run on out-of-order processors. You can find the list of Intel supported and validated metrics at our GitHub* site and each new generation of metrics are contributed to the Linux* perf tool.
With the addition of formerly code named Meteor Lake and code named Granite Rapids products, the metrics have evolved to take advantage of this new technology. In the upcoming releases of top-down microarchitecture analytics (TMA), TPEBS is used in formulas for some TMA metrics. Using TPEBS in TMA helps improve metric result accuracy and more easily pinpoint the bottlenecks. TPEBS, as an extension of PEBS, captures retired latency data when a PEBS assist event is triggered. There are challenges in supporting the extension in counting mode for performance monitoring tools because of the sampling nature of TPEBS. We are experimenting with TPEBS data collection, designing TPEBS counting mode in the Linux perf tool, and implementing the selected design.
This article explains our experimental findings on the retire latency characteristics. The results indicate that enabling TPEBS to collect retire latency values for metrics in real time helps improve TMA metric accuracy. We also describe the design we implemented in the Linux perf tool with several planned future improvements.
What Does PEBS Help?
PEBS is an important functionality of a PMU. For PMU events that support PEBS, the general-purpose PMU counters are used to count the occurrence of the selected events. When a PMU counter overflows, PEBS records the machine state (the state after the instruction that triggers the overflow) to a memory buffer. For details on the PEBS record format and all the extensions of PEBS facility, see Intel® 64 and IA-32 Architectures Software Developer’s Manual.
PEBS records system information like Instruction Pointer. This data is critical in use cases like software hot spot analysis and flame graph generation. Comparing with software-based sampling, PEBS mitigates the skid problem and largely reduces sampling overhead. The Reduced Skid mechanism and Precise Distribution (PDist) help improve skid problem even further. With the Reduced Skid mechanism, skid is precisely one event. PDist, supported by selected counters and events, eliminates all skids.
What Is TPEBS and Retire Latency?
The TPEBS feature adds a 16-bit retire latency field in the Basic Info group of the PEBS record. The feature records the core cycles from the retirement of the previous instruction to the retirement of current instruction (the one triggered the PEBS assist). More details about TPEBS may be found in Intel® Architecture Instruction Set Extensions and Future Features: Programming Reference.
What Are Metrics and TMA?
Top-down Microarchitecture Analysis (TMA) is an analysis method for identifying true performance bottlenecks in out-of-order processors. It is an easier method that does not require in-depth microarchitecture knowledge from users. It is also accurate for characterizing performance at a microarchitecture level because it measures performance at pipeline slot granularity. A pipeline slot is an abstraction that represents the hardware resource available for micro-operations (uop) per CPU core cycle. In a microarchitecture that issues 4 uops to the pipeline per cycle, the pipeline slot is 4. The method measures a set of metrics and uses them in a drill-down tree-based manor. Graph 1 includes the major TMA metric names and the hierarchy. At the first level, there are four metrics: front end, back end, retiring, and bad speculation.
Figure 2 and figure 3 show an example of the drill-down process using the Linux perf tool. TMA metrics are supported in Linux perf tool through perf stat with option -M. The process starts from the first-level metrics and continues to the second level based on the values of the four metrics. In this example, Backend Bound has highest value, therefore, we continue to check the child nodes of Backend Bound. At the second level, the Core Bound metric is highlighted by the tool, so we continue to its child nodes in the third level. This process continues until it reaches the real bottlenecks, which are Ports_Utilized_1 and Ports_Utilized_2 in this example. For more details about this methodology, see A Top-Down Method for Performance Analysis and Counters Architecture and Intel® 64 and IA-32 Architectures Software Developer’s Manual.
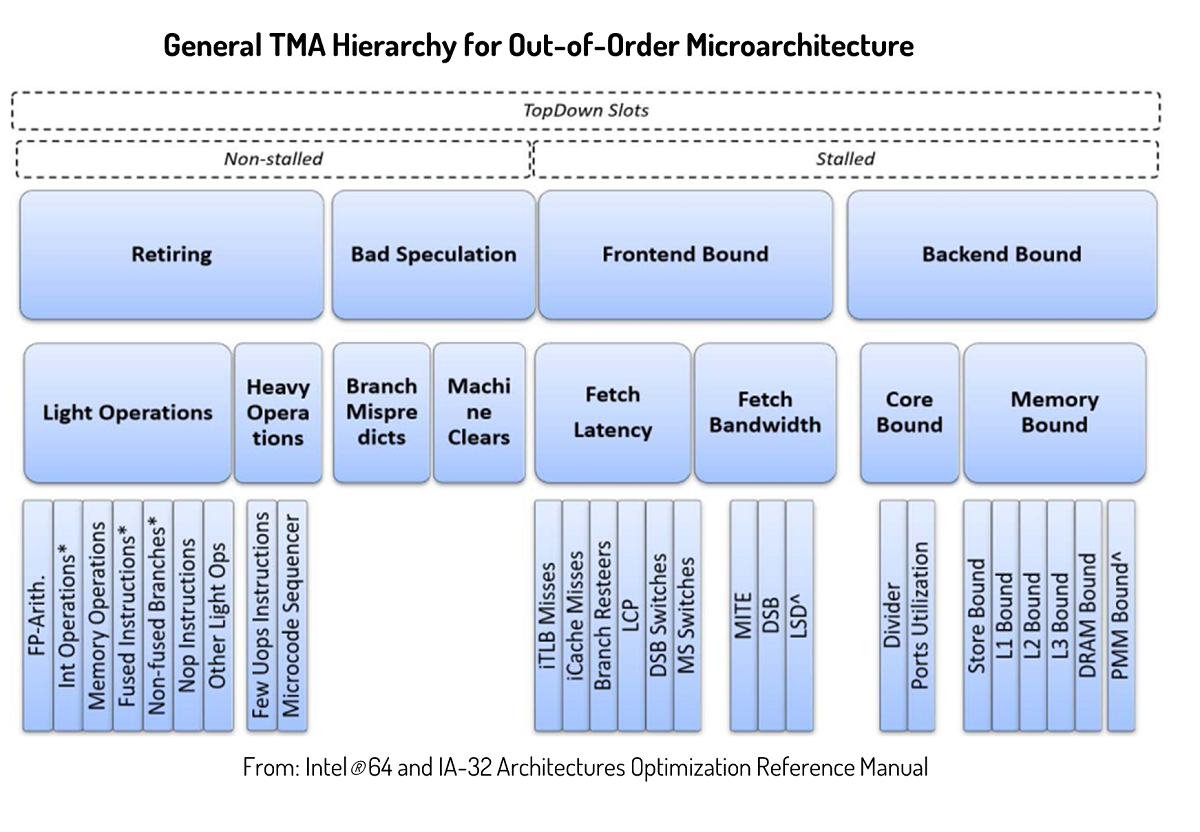
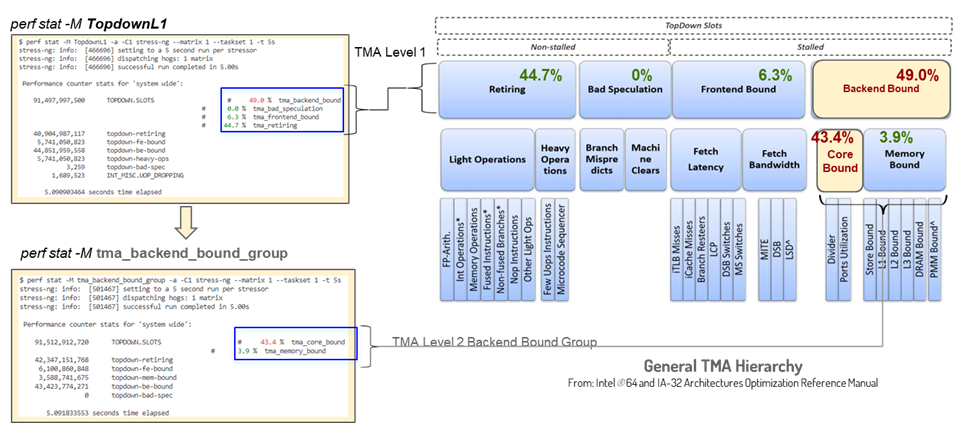
Figure 2. TMA drill down with Linux perf example: part 1
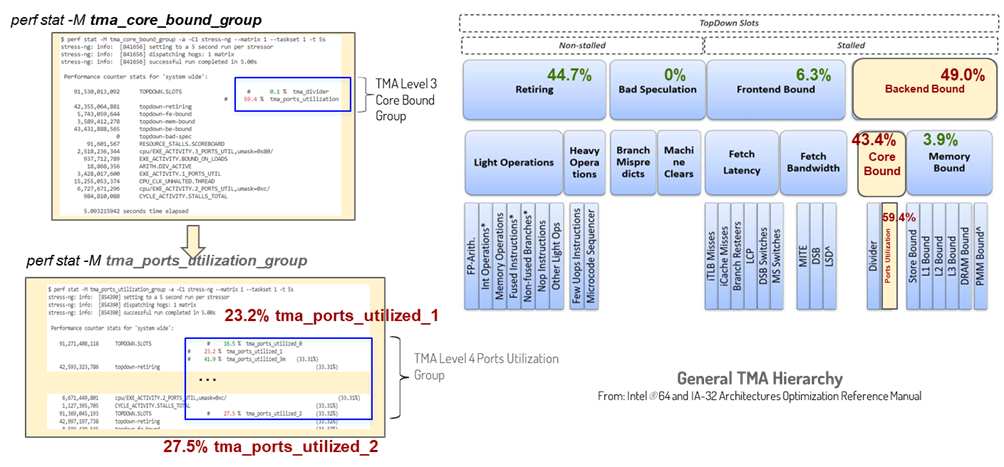
Figure 3. TMA drill down with Linux perf example: part 2
Why Use TPEBS in TMA?
In the most recent release of TMA, the metrics begin to use event retire_latency values in some of the metrics' formulas on processors that support TPEBS feature. For previous generations that do not support TPEBS, the values are static and predefined per processor family by the hardware architects. Due to the diversity of workloads in execution environments, retire latency values measured in real time are more accurate. Therefore, new TMA metrics that use TPEBS provide more accurate performance analysis results.
How do TPEBS and TMA Work Together?
As the name suggested, PEBS is the PMU facility for sampling performance profiling for the mode. TPEBS, as an extension of PEBS, works naturally in sampling mode. On the other hand, TMA is a methodology that could be easily used in counting mode. To support TMA that uses TPEBS in counting mode is a combination of counting mode and sampling mode features. It requires design effort in the existing performance monitoring software tools including the Linux perf tool.
Sampling Mode and Counting Mode
Use the performance monitoring capabilities in counting mode or interrupt-based sampling mode. In the first mode, the counters are used to tally the number of occurrences of selected hardware events. These counts can be aggregated, used in formulas to calculate metric values, and reported to users in the required format.
In sampling mode, the counters are configured with predefined values. Counters are still increased by one whenever an event occurs. When the count reaches the upper bound and overflows, an interrupt happens and causes the hardware to generate a PEBS record.
How Does Linux Perf Do Sampling and Counting?
Linux perf tool is a powerful and widely used performance tool that supports PMU counters, software events, tracepoints, and so on. Its source code is part of the Linux kernel and maintained within Linux kernel source code repo under the tools/perf directory.
The Linux perf tool supports PMU capabilities in the counting mode and sampling mode with different subcommands. The subcommand record is for performance sampling. Perf record has been supporting PEBS stably and used in a lot of scenarios, even in production systems for performance monitoring. Since TPEBS is an extension of PEBS, supporting TPEBS in perf record is intuitive.
Usually a user runs perf record to do sampling first and get an output data file. Then the user could run a perf report or perf script to post process the data file to read and analyze the results. Generating a flame gragh is an example of perf record use.
The -e option would get perf record to collect sampling data on PMU events. With option -W, perf record would collect weighted sample data, which includes the TPEBS retire latency value.
Perf stat is another important subcommand that enables counting mode performance monitoring. Together with PMU hardware events, it provides accurate performance results while maintaining minimum performance overhead. Perf stat supports both PMU events and metrics through options -e and -M. Perf stat also has up-to-date support on the TMA method. As mentioned earlier, enabling TPEBS in perf stat is a challenge because of the retire latency value of events used in TMA metric formulas. To calculate those metrics, the perf stat needs to collect count values and retire latency values of required events. The next section discusses this in detail.
Results from Our Experiments
The retire latency value of an event might have large variations depending on both workloads and execution environments. Figure 4 shows retire latency values of several different events collected with the SPECCPU2017 505.MCF workload on a system with an Intel Core Ultra processor. The data shown in three colors that are from three separate runs using perf record -e, which share similar characteristics. The x axis is the run time in seconds; the y axis is the retire latency of each event (event name shown as title of each subgraph). Data in this graph indicates even within one workload, at different stages, the retire latency could change dramatically.
Figure 5 below shows the variations of event counts across runs using the same workload and testing system. We collected the count values using perf stat -e in several individual runs such as Run 0, 1, and 2. We also ran perf stat -e with perf record -e to mimic the method that ran perf stat and perf record in parallel and got results shown in Test 0, 1, 2, and 3, where the four different tests ran sampling at different lengths of time throughout the execution time of the workload. While different from retire latency values, count values are stable for most of the events in all five types of experiments. The standard deviation of each event is shown in the yellow bar of each subgraph. Based on graph 1 and graph 2, we think the accuracy of retire latency values measured from tools would be critical to the accuracy of final metric values.
Variation of the retire latency values would be even more impressive for applications that run on server or cloud environments with unpredictable neighbors. Therefore, we believe retire latency collected at real time should be more accurate and help to find real performance bottlenecks on production systems.
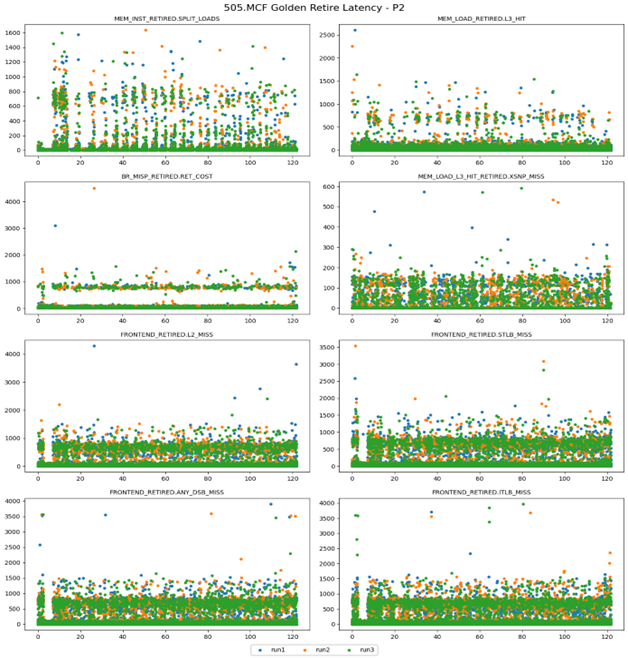
Figure 4. Example of retire latency value distribution
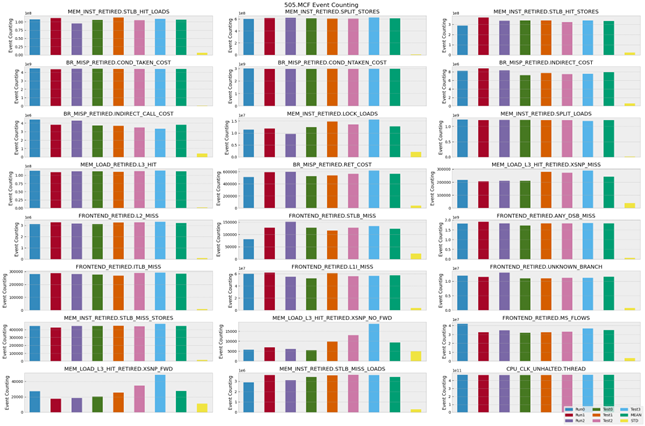
Figure 5. Example retire latency and event count variations
Design and Implementation in Linux Perf
TPEBS sampling mode has been enabled in perf record. Its intuitive design uses perf record to collect retire latency values and uses perf stat to collect counts and calculate metric results. This design needs the least amount of code change in the perf tool and requires minimum running permission from the users, the same permission requirement as perf record and perf stat. Because of these benefits, we implemented this design—it helped us get this feature upstreamed and became available to customers and public users quickly.
Figure 6 shows the detailed architecture of the TPEBS counting mode implementation in Linux perf tool using perf stat and perf record. Since perf stat is the canonical way to collect TMA metrics, perf stat is also used as the subcommand to collect metrics that require the retire_latency. When perf stat receives one or more metrics from the command line, it parses formulas of the metrics to prepare a list of events that are used to calculate the metrics. In metric formulas that requires retire_latency data, it automatically generates another list of event names. Then it forks perf record with the -W option for retire_latency and passes the list of event names to it. After both perf record and perf stat preparation works are done, the data collection starts. Counting and sampling run in parallel on the system.
When the counting work stops, perf stat sends a SIGTERM signal to the perf record process. Perf record stops sampling after receiving the signal. During the runtime, another thread from perf stat is created to process sample data that passed back from perf record through a PIPE. Perf stat processes the sampling data to extract all the retire_latency values it needs for metric calculations. After retrieving all the counts and retire_latency data, perf stat calculates metrics results and prints out all the requested data in selected formats based on user command options.
Figure 6. TPEBS counting mode in Linux perf design
Challenges
During the implementation, we encountered several challenges. In the design, we introduced as little requirements for extra running permissions as possible. However, even when we implemented forking the perf record from perf stat, there were still potential changes to run the requirements. The perf record stores sampling data into a file by default. This file requires create and write permissions that perf stat does not need. In addition to the extra permission requirement, this data file size could grow large for long-term sampling. To solve this problem, we used a PIPE connecting perf record with a perf stat to pass sampling data. We also created a dedicated thread to process the sampling data so that the PIPE will not get full and block the processes.
Another difficulty was a lack of sample data with short monitoring time in experiments. It took us a long time to debug this issue, but when we did, we found that the perf record had a longer initialization time than the perf stat. In this design, the perf stat was launched and initialized first. During this process, perf stat parsed formula and launch perf records when retire_latency of events was required. So, perf record not only took longer to initialize but also started after perf stat did a large portion of the initialization work. To solve this issue, we used an ad hoc solution: Adding a short sleep in the perf stat to wait for the perf record to initialize.
Another problem was how to support different use cases for the perf tool. There are many command-line options in the perf tool that support different use cases: -a for system-wide issues, -C for monitoring specific cores, -I for printing counts at regular intervals. In many cases, for options that are supported in both perf record and perf stat, the options can pass to the perf record. However, there are options that cannot be easily supported. One example is the -I option.
Usually, -I is followed by a value representing a time length (usually less than a few seconds). The perf stat then calculates metric results and prints out counts at this regular interval. It is hard to support this feature when retire_latency values come from sampling for metric calculation. We plan to support this use case with a different method, which is described in Future Improvements.
Get the Code Patch
The implementation for real-time sampling with a perf stat for TMA metrics that use retire latency values is available from the Linux Kernel Mailing List. Version 4 of the patch set is available at Lore.Kernel.org.
Future Improvements
A Default Retire Latency Value for TPEBS
For use cases that are incapable of measuring retire latency in real time, predefined retire latency values of events will be provided. This data is measured on a set of representative applications, such as binaries of SPECCPU benchmark compiled with different compilers. For performance monitoring software tools that support default retire latency values, the tools design methods to use the data as needed. For example, searching for values in an application that is similar to the application being tested.
In the perf tool, we plan to set average retire latency data as default TPEBS parameters. For use cases that run sampling to get real-time retire latency values, the future option would allow users to activate sampling from a command line.
In addition, we plan to add another new method that allows the user to input retire latency with another new command line option.
Currently, toplev (a performance analysis tool on top of Linux perf) can use default retire_latency value or capture retire_latency values and cache them for TMA with TPEBS.
Additional TPEBS Statistical Values
TPEBS has several recommended statistical values: minimum, maximum, arithmetic mean, and more. Our current implementation chooses arithmetic mean in the code. A future implementation may allow the user to select the type of values to use.
Design Change
A possible future design is to use bpf in perf. Support metrics with retire latency values using bpf would introduce less performance overhead at performance monitoring time than perf stat and perf record. However, the potential disadvantage of this method is that the strict permission requirement will hold back many users.
Sample Read with a Perf Record
Supporting TPEBS counting mode is challenging because of its sampling nature. A possible solution is to collect sampling data and counts in the perf record. Currently, a sample read in the perf record supports recording sample data from one event and counts other events in the same group. For our purposes, there should be a lot of use cases that require more than one event's sample data at a time. Enhancing the sample read capability for more than one event per group is possible. But, it requires code changes in a kernel, which is a potential restriction for some users.
Another possible use of this feature is to use a sample read only in the use cases that require retire_latency from only one event. This is achievable without any kernel changes.
Conclusion
We explained what TPEBS is and why it's enabled in counting mode in the Linux perf tool. We also described the reasoning and the architecture of our design and implementation. In the future, based on feedback from customers, domain experts, and the community, we will selectively implement the designs we described in the future implementation section to improve the current implementation.