Note: Some screenshots in this article show orange dots. This is not a default setting, and these dots would be red or yellow by default. The orange category between red and yellow was added through the customization menu.
The Roofline with Callstacks is an extension of the existing Cache-Aware Roofline feature in Intel® Advisor. This feature was officially introduced in 2018 Update 1, though it was available as a preview under the name Hierarchical Roofline in the initial 2018 release. The name has since been changed to avoid confusion with a different feature with a similar name.
The mechanical difference between the original Cache-Aware Roofline and the Roofline with Callstacks is the treatment of self data vs total data. Self data is data (memory accesses, FLOPs, and duration) related only to the loop or function itself, excluding data originating in other functions or loops called by it. Total data includes data from called functions and loops in addition to that originating in the outer function or loop.
for (int x = 0; x < X_MAX; x++)
{
 /* These three lines count toward both the self and total
  * data for the outer loop. */
 bar[x * 2] = x * 42.0 + 7.0;
 bar[(x * 2) - 1] = (x - 1.0) * 42.0 + 7.0;
 bar[x] = 23.9 * 83.9 / 31.2;
 /* Operations performed in foobar() and the inner loop
  * only count toward the total data for the outer loop. */
 foobar();
 for (int y = 0; y < Y_MAX; y++)
 {
  foo[y*2] = y * 42.0 + 7.0;
 }
}
In Advisor’s original Cache-Aware Roofline, only self data was shown, and relationships between dots were not indicated.The Roofline with Callstacks makes use of total data in addition to the self data, and provides both a navigable callstack and visual indicators to allow easy identification of related dots.
Use Cases


The ability to use total data gives the Roofline with Callstacks a means of adjusting the granularity of the data. In Advisor’s original implementation of the Roofline, it would have been impossible to get a sense of where the outer loop of the above example, as a whole, would stand. Only the inner loop, the self-data of the outer loop, and foobar() – which does not call anything else – would have been shown.
The original Cache-aware Roofline provided insights into which loops were worth the effort to optimize, in and of themselves, but a cluster of small dots all called from the same location may have evaded notice.

The Roofline with Callstacks allows simplification of a dot-heavy Roofline. Several small loops may share an origination point, and it can be beneficial to collapse them into one overall representation of the dot cluster rather than trying to read a chart with dozens of small dots.
By revealing their shared origination point, it allows a developer to investigate the source of the loops rather than just the loops themselves, potentially uncovering a design inefficiency higher up the call chain which could be the root cause of the smaller loops’ poor performance.
The Roofline with Callstacks is also extremely useful for getting a more accurate view of functions or loops that behave differently when called under different circumstances. Where the original Cache-aware Roofline rendered one dot per function, the inclusion of calling information differentiates instances of a function or loop that have different callstacks, thus allowing their behavior and traits to be analyzed separately.
Running the Analysis
Note: For users with the 2018 initial release, the preview feature will need to be enabled by setting the environment variable ADVIXE_EXPERIMENTAL=roofline_ex before starting Advisor to collect and/or view Roofline with Callstack data. For users with 2018 update 1 or later, this setup step is not necessary.
In the GUI
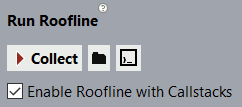
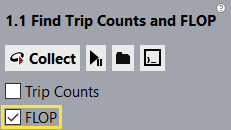
As with the standard roofline, the analysis can be run using either the Run Roofline shortcut button or by running a Survey analysis followed by a Trip Counts analysis with FLOPs (the Trip Counts themselves are optional). In either case, the “Enable Roofline with Callstacks” checkbox under the Run Roofline shortcut button must be checked.
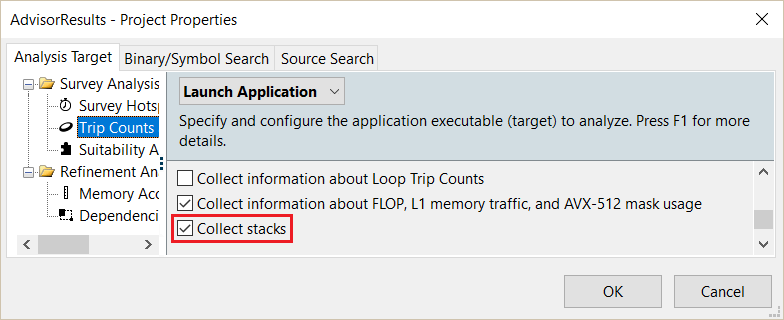
The "Enable Roofline with Callstacks" checkbox is functionally identical to the “Collect stacks” checkbox in the Trip Counts and FLOPs Analysis tab of the Project Properties, and toggling one checkbox will toggle the other.
When viewing the results, be sure to check the “Show Roofline with Callstacks” checkbox in the upper right corner, next to the roofline options. If this checkbox is not visible, widen your roofline display until it appears.
On the Command Line
To collect Roofline with Callstacks information on the command line in 2018 update 1, simply use:
advixe-cl -collect roofline -stacks -project-dir MyResults -- MyExecutable
If you prefer to collect the survey and trip counts analyses separately, or wish to add FLOPS data to a standard survey report you’ve already been working with, use the flop and stacks flags in the command line:
advixe-cl -collect survey -project-dir MyResults -- MyExecutable
advixe-cl -collect tripcounts -flop -stacks -project-dir MyResults -- MyExecutable
Collection of actual trip counts data is completely optional, as it's the FLOPs that are important.
Note: Neither the roofline collection type nor the flags given above exist in the 2018 initial release. For this version, check that your environment variable is set, then run a standard survey collection followed by a tripcounts collection with the following flags:
advixe-cl -collect survey -project-dir MyResults -- MyExecutable
advixe-cl -collect tripcounts -flops-and-masks -callstack-flops -project-dir MyResults -- MyExecutable
These flags are deprecated in update 1, in favor of the -flop and -stacks flags.
Reading the Chart
The Roofline with Callstacks adds several more symbols and visual indicators to the Roofline chart. For information regarding the basics of reading a Roofline in general, see the Intel® Advisor Roofline article.

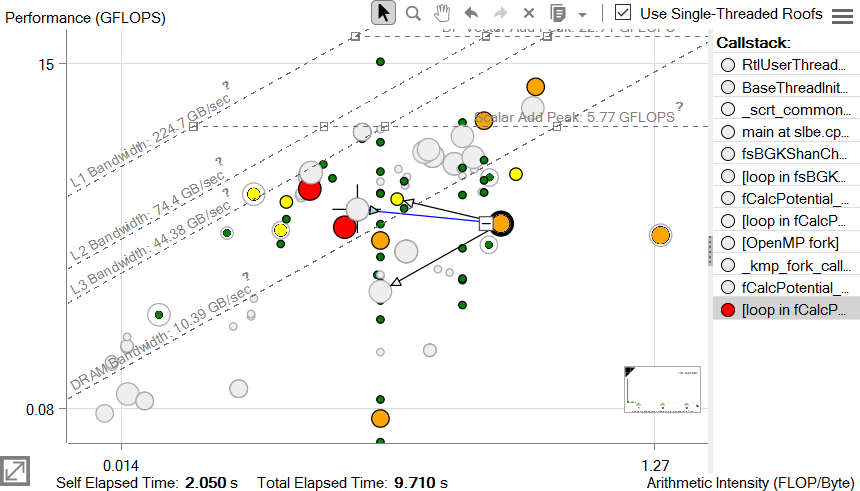
One of the most obvious new features are the caller/callee arrows. Upon selection of any given dot on the chart, its direct caller and callees will be indicated by these lines. In the image to the left, the orange dot B is selected, and has a blue line with a backwards arrowhead indicating that the gray dot A is the caller, while black lines with normal arrowheads at the end indicate that the selected loop directly calls the yellow loop C and the gray loop D.

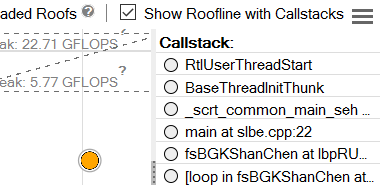
The other most obvious feature is the Callstack display on the right. This list displays the entire call chain for the selected loop (but excludes its callees). As you can see in the image to the right, each level of the stack has a dot next to it, which displays the current color of that dot on the chart.
Clicking an entry in this list will cause the corresponding dot to flash on the Roofline chart, for easy identification.
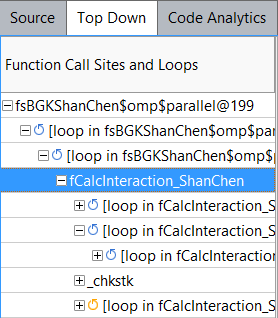
A more detailed call tree can be found in the lower pane, under the Top Down tab. Rather than a single call chain, this displays the whole tree. Branches can be expanded and collapsed, allowing you to find less directly connected nodes.
Similarly, the dots in the Roofline chart can also be expanded and collapsed with their own plus and minus buttons. As with the call tree, everything under a given node, even if it’s not a direct callee, will be hidden when that node is collapsed.
Collapsing or expanding dots switches whether the dot’s display is based on the self data or the total data. Loops and functions that have no self data will simply be grayed out when expanded and in color when collapsed. Nodes that do have self data display at the coordinates, size, and color appropriate to that data when expanded, but have a gray halo of the size associated with their total time. When these loops are collapsed, they will change to the size and color appropriate to their total time, and if applicable, will move to reflect the total performance and total AI.

The grey information box on the left in the above animation is not present in Advisor, and was edited into the image for additional clarity. However, the information it displays can be found within Advisor in the Code Analytics tab in the lower pane, located next to the Top Down tab. The Code Analytics tab contains a variety of helpful metrics in several collapsible sections. Information on both self and total AI, memory accesses, elapsed time, and FLOPs can be found in the FLOPS collapsible.
As a final note, the cross icon in the Roofline chart represents the application as a whole, being placed at the coordinates of the Total AI and Total GFLOPS of the entire program. As the root node of the chart has the entire application in its call tree, its total data is that of the entire program. Thus, the root node will always collapse to the location of the cross.