This quick yet comprehensive tutorial will walk through the simple steps to profile a Python application’s performance using VTune™ Profiler on NumPy* and Numba* example applications.
You will learn how to
- Install and use the Intel® Distribution for Python and Data Parallel Extensions for Python with your applications, and thus get a head start on Python performance when using Intel platforms.
- Set up your VTune™ Profiler environment for use with Python.
- Profile 3 different Python application implementations to identify bottlenecks and opportunities for performance tuning. This article will use the NumPy example of a pairwise distance calculation algorithm frequently used for machine learning and data analytics.
The 3 different implementations are using the following packages.
-
- Intel Optimized Numpy
- Data Parallel Extension for NumPy
- Data Parallel Extensions for Numba on GPU
The NumPy and Data Parallel Extension for Python
Intel® Distribution for Python and Intel® Data Parallel Extension for Python provide a great and simple way to build high-performance machine learning (ML) and scientific applications by enabling optimized heterogeneous computing.
The Intel® Distribution for Python* adds:
- Scalability using all available CPU cores on laptops, desktops, and powerful servers.
- Support for the latest Intel® CPU instruction sets.
- Near-native performance through acceleration of core numerical and machine learning packages with libraries like the Intel® oneAPI Math Kernel Library (oneMKL) and Intel® oneAPI Data Analytics Library (oneDAL).
- Productivity tools for compiling Python code into optimized instructions.
- Essential Python bindings for easing integration of Intel native tools with your Python project.
The Data Parallel Extensions for Python consist of 3 foundational packages:
- dpnp (Data Parallel Extensions for NumPy)
- numba_dpex (Data Parallel Extensions for Numba)
- dpctl (Data Parallel Control library with utilities for device selection, allocation of data on devices, support for tensor data structure, and user-defined data parallel extensions for Python)
To quickly identify and resolve unexpected performance issues in Machine Learning (ML), Artificial Intelligence (AI), and other scientific workloads, it is best to gain insights with in-depth source code level analysis into compute and memory bottlenecks. With Intel VTune Profiler, this can be achieved not only for C/C++ but also for Python-based ML and AI code. This article focuses on ways to profile these types of Python applications.
Intel VTune Profiler is a powerful tool that helps developers pinpoint the source lines responsible for performance loss and replace them with highly optimized Intel Optimized Numpy and Data Parallel Extension for Python libraries.
Installation and Setup
1. Install Intel Distribution for Python
2. Create a Python Virtual Environment
python -m venv pyenv
pyenv\Scripts\activate
3. Install Python packages
pip install numpy
pip install dpnp
pip install numba
pip install numba-dpex
pip install pyitt
More information on these installations can be found here.
Reference Configuration
The hardware and software components used for the reference example code we use are:
Software Components:
- dpnp 0.14.0+189.gfcddad2474
- mkl-fft 1.3.8
- mkl-random 1.2.4
- mkl-service 2.4.0
- mkl-umath 0.1.1
- numba 0.59.0
- numba-dpex 0.21.4
- numpy 1.26.4
- pyitt 1.1.0
Operating System:
- Linux*, Ubuntu* 22.04.3 LTS
CPU:
- Intel® Xeon® Platinum 8480+
GPU:
- Intel® Data Center GPU Max 1550
Note: The Intel VTune Profiler can be downloaded and installed as a standalone distribution or as part of the Intel® oneAPI Base Toolkit.
The NumPy Example Application
We will show the step-by-step optimization of a NumPy application using Intel VTune Profiler and its Intel® Instrumentation and Tracing Technology (ITT) API. This article will use the pairwise distance application, a popular algorithm in applications such as machine learning, geospatial data analytics, biology, high performance computing (HPC) and more. Here is a reference source code excerpt:
Overview
Here is a short description of the 3 steps of optimization that we are going to cover in this article:
Step 1: Profiling Intel Optimized Numpy Implementation of Pairwise Distance: Here, we will try to understand the bottlenecks hurting the performance of the NumPy implementation.
Step 2: Profiling Data Parallel Extension for NumPy Implementation of Pairwise Distance: We will analyze the implementation and try to see the performance difference.
Step 3: Profiling Data Parallel Extension for Numba GPU Implementation of Pairwise Distance: Evaluation of the GPU performance of numba-dpex implementation
Step 1: Profiling NumPy Implementation of Pairwise Distance
Insert ITT APIs in the NumPy implementation to designate logical tasks:
We get the following results after running the Intel® VTune™ CPU Hotspots Analysis on the ITT annotated code:

Figure 1: Hotspots Analysis of NumPy Code
Here is a sample command line that you can use to generate hotspot analysis results like those in Figure 1:
vtune -c hotspots – python numpy_implementation.py
As can be seen from Figure 1, the code takes ~130s to execute and spends a significant time in serial spinning. Also, Intel VTune Profiler recommends running the threading analysis and Microarchitecture Exploration to understand the bottlenecks better.
Figure 2 shows the Top Tasks taking most of the time of this NumPy implementation. It consists of 2 types of tasks: the tasks created by the ITT API tasks (logical tasks) and platform tasks. As can be seen from the figure, the pairwise_dot task is the most dominant, taking almost ~118 ms.
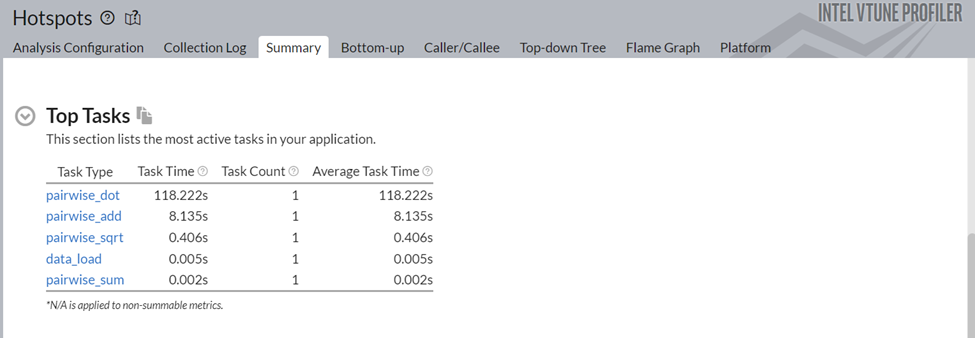
Figure 2: Top Tasks of Pairwise Distance Application
If we click on the pairwise_dot task, we are redirected to the bottom-up view, which gives us a better understanding of the APIs inside that task.
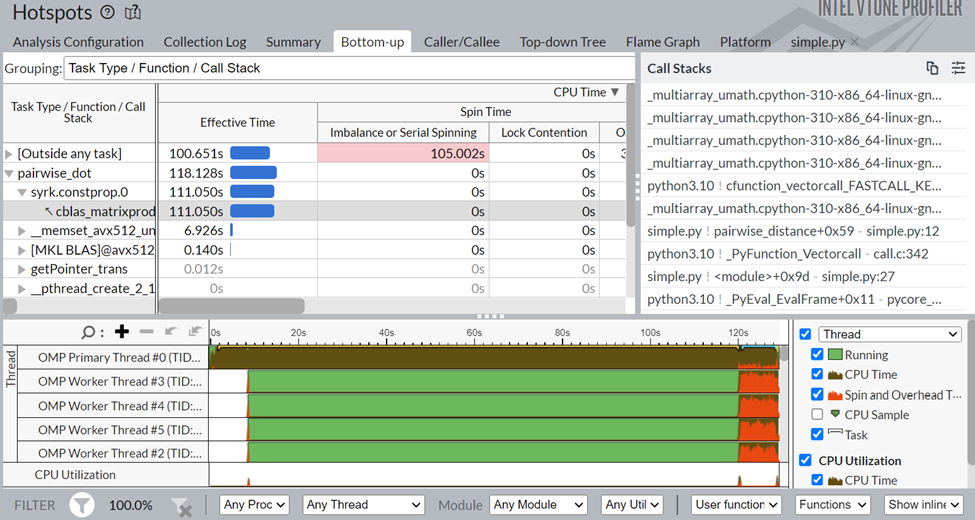
Figure 3: Bottom-up view of Pairwise distance application
As seen in Figure 3, the pairwise_dot task has several APIs associated with it. The syrk oneMKL routine is the most consuming, followed by memset and other minor operations.
Also, from Intel VTune Profiler’s source line mapping (Figure 4) capability, we can confirm that the np.dot function is responsible for 33.0% of the total execution time.

Figure 4: Source line view of the bottleneck
So, optimizing the dot function or replacing this dot function with a more performant API could significantly improve the application’s runtime.
Step 2: Profiling Data Parallel Extension for NumPy Implementation of Pairwise Distance:
To optimize the bottlenecks found in step 1, we will switch to the Data Parallel Extension for NumPy implementation. The only change required here is to replace import numpy as np with import dpnp as np.
Now, let's profile the Data Parallel Extension for NumPy implementation using Intel VTune Profiler to see whether it alleviated the bottleneck.
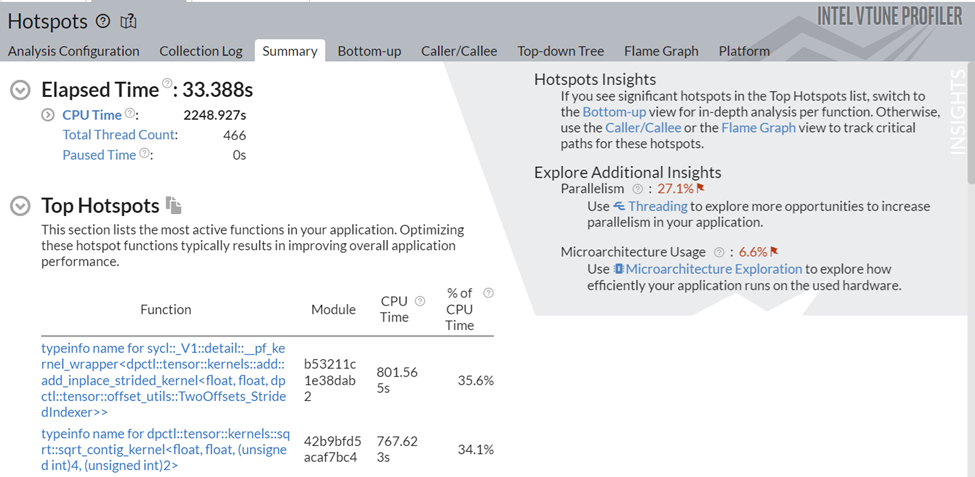
Figure 5: Hotspots Analysis of Data Parallel Extension for NumPy* Implementation
Figure 5 shows a significant improvement in total runtime. Now, let’s understand what is responsible for this performance boost and whether the use of the Data Parallel Extensions reduced the bottlenecks observed in the previous implementation.
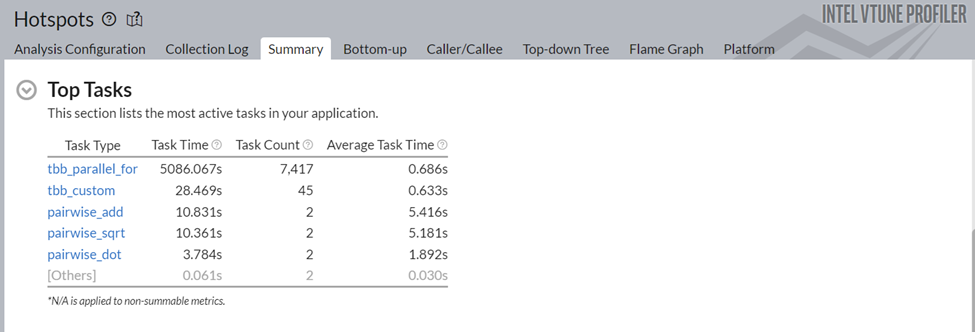
Figure 6: Top Tasks of Data Parallel Extension for NumPy* Implementation
Figure 6 shows some substantive improvements in the different top tasks of this application. For example, the task time of pairwise_dot has dropped from 118.2s to 3.78s. Now, let us understand the changes introduced by the Data Parallel Extensions for NumPy library.
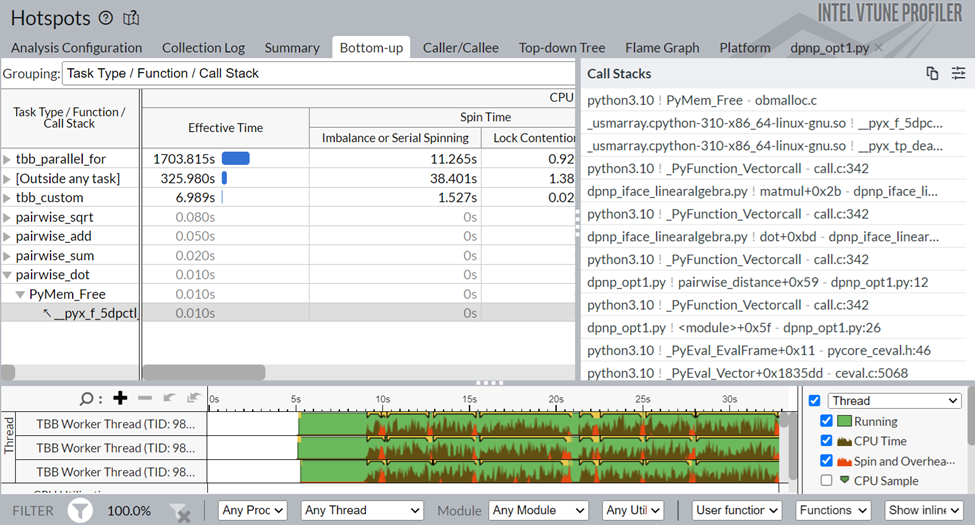
Figure 7: Bottom-up view of Data Parallel Extension for NumPy Implementation
As can be seen from Figure 7, the pairwise_dot task is now using dpctl APIs, unlike the previous Intel-Optimized NumPy implementation’s oneMKL APIs, which is contributing to the performance boost.
As we saw from the Hotspots Analysis, Intel VTune Profiler thinks there is more scope for increasing parallelism for this application. Therefore, we will switch to Numba GPU implementation in the next step to further improve the performance.
Step 3: Profiling Data Parallel Extension for Numba GPU Implementation of Pairwise Distance:
Here is the code snippet for the GPU implementation:
We get the following results when we run GPU Hotspots Analysis on the Numba implementation:

Figure 8: Summary view of gpu-hotspots of Data Parallel Extension for Numba Implementation
So, using the Numba GPU implementation, we can see a significant (~3x) speed-up.
As can be seen from Figure 8, only Stack 0 of GPU 0 was utilized out of the 4 GPUs available on the system. The Idle time was high, which is expected in case of smaller workloads. However, we can see some significant improvement in the total execution time.
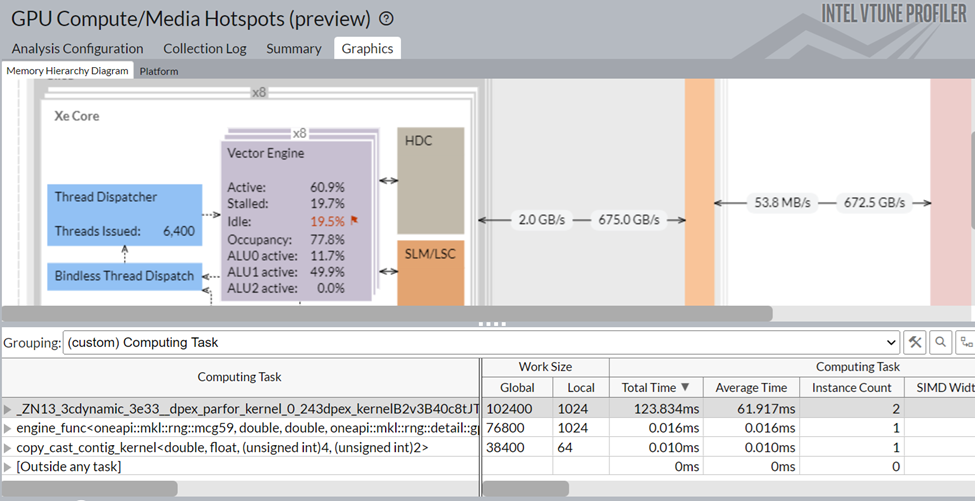
Figure 9: Graphics view of gpu-hotspots analysis of Data Parallel Extension for Numba implementation
If we group the table at the bottom of Figure 9 with the Computing Task, we can see that the Numba dpex_kernel is taking most of the time, which is expected. Also, this kernel has shown good GPU utilization (Xe Vector Engine activity level ~60.9%).
Note: For larger workloads with several kernels, you can also specify the kernels you are interested in using knob computing-tasks-of-interest.
Turbo-Charge Your NumPy Python Application
We have seen how to use Intel® VTune Profiler to identify compute and memory bottlenecks in a Python application quickly.
- Intel VTune Profiler helps determine the underlying cause for bottlenecks and ways to speed up application performance.
- It can help map the tasks responsible for the primary bottlenecks to source code/ assembly level and show the corresponding time spent in CPU/GPU
- Using the Instrumentation and Tracing API (ITT APIs) can provide developers with even more in-depth, developer-friendly profiling results.
Test it Yourself
To walk through these steps yourself and apply them to your own application, you can simply do the following:
- Set up your own environment as described at the beginning of this article.
- Run any examples provided here, or use your own development project.
- Profile the application using Intel VTune Profiler to detect and then fix any bottlenecks.
For best results, leverage the optimized Intel Optimized Numpy and Data Parallel Extension for Python.
Get the Software
You can install Intel VTune Profiler as a part of the Intel® oneAPI Base Toolkit or download its stand-alone version for free!
The Intel Optimized Numpy provides an optimized one-stop shop for Python development targeting Intel architectures.
Additional Resources
Here are the links to find out more about Intel VTune Profiler and get started with profiling and tuning your workload:
- Profiling Machine Learning Applications
- Intel VTune Profiler Landing Page
- Intel VTune Profiler User Guide
- Intel VTune Profiler Performance Analysis Cookbook
- Intel VTune Profiler Training Video Series on YouTube