Introduction
Intel® VTune™ Profiler is a performance analysis tool for serial and multithreaded applications. Use Intel VTune Profiler to analyze your choice of algorithm. Identify potential benefits for your application from available hardware resources.
This article demonstrates how to profile an application in one Docker* container (the target) using Intel VTune Profiler, which exists in another Docker container (the host). This makes it easier to use Intel VTune Profiler on an unsupported operating system or infrastructure.

Analysis Types within Intel VTune Profiler
Performance Snapshot
- Get an overview of the issues that affect the performance of an application on your system. The analysis is a good starting point that recommends areas for deeper focus. You also get guidance on other analysis types to consider running next.
Algorithm
- Hot Spots: This analysis type investigates call paths and finds where your code is spending the most time. Use it to identify opportunities to tune your algorithms.
- Anomaly Detection: Identify performance anomalies in frequently recurring intervals of code-like loop iterations. Perform fine-grained analysis at the microsecond level.
Microarchitecture
- Microarchitecture Exploration (formerly known as General Exploration): This is best for identifying the CPU pipeline stage (front end, back end, and so on) and hardware units responsible for your hardware bottlenecks.
- Memory Access: This is best for memory-bound applications to determine which level of memory hierarchy is impacting your performance. It reviews CPU cache and main memory use, including possible non-uniform memory access (NUMA) issues.
Parallelism
- Threading: Visualize thread parallelism on available cores, locate causes of low concurrency, and identify serial bottlenecks in your code.
- HPC Performance Characterization: Understand how your compute-intensive application is using the CPU, memory, and floating-point unit (FPU) resources.
Accelerators
- GPU Offload: Targeted for applications using a graphics processing unit (GPU) for rendering, video processing, and computations, this helps you identify whether your application is CPU or GPU bound.
- GPU Compute and Media Hot Spots: Targeted for GPU-bound applications, the hot spots help analyze GPU kernel execution per code line and identify performance issues caused by memory latency or inefficient kernel algorithms.
- CPU and FPGA Interaction: This analysis explores FPGA use for each FPGA accelerator and identifies the most time-consuming FPGA computing tasks.
Intel VTune Profiler allows you to profile applications running in Docker containers, including profiling multiple containers simultaneously. Learn how to profile an application that is running on a target Docker container using Intel VTune Profiler that is installed on the host Docker container.
Prerequisites
- Install Docker on Ubuntu*
apt install docker.io
- Install the stand-alone Intel VTune Profiler or as part of the Intel® oneAPI Base Toolkit (Base Kit) on the host Docker container.
Note The Docker image for the Base Kit can also be downloaded from the Docker Hub*. If it is installed on any other Docker image, you must set environment variables with the following command:source /opt/intel/oneapi/vtune/latest/vtune-vars.sh
Set Up Docker Containers
Before starting the Docker containers, create a bridge network that helps to install third-party or any custom network drivers. To do this, open a command prompt, and then run the following commands:
docker network create -d bridge test
Test is a bridge network name. If needed, you can replace it with another name.
-d, --driver string Driver to manage the Network (default "bridge")
Set Up the Host and Target with Docker
- Start a host (with Intel VTune Profiler installed) and target container with the following command:
docker run --rm -dti --name <docker-name> --network test --cap-add CAP_SYS_ADMIN <Image_name>
Examples:- For a host container with Intel VTune Profiler installed, use the following command:
docker run --rm -dti --name Host --network test --cap-add CAP_SYS_ADMIN intel/oneapi-basekit
- For a target container with an application running the container, use the following command:
docker run --rm -dti --name Target --network test --cap-add CAP_SYS_ADMIN gcc
- For a host container with Intel VTune Profiler installed, use the following command:
Where:
- --rm is a clean-up flag that removes any anonymous volumes associated with the container when it is removed.
- -dti:
- -d (--detach) is a detach mode
- -t allocates a pseudo-TTY
- -i (--interactive) keeps STDIN open even if not attached
- --name: Assigns a name to the container, such as: --name Host.
- --network: Connects a container to a network. Since you created a bridge network with the name test, test is used in the previous command.
- --cap-add: CAP_SYS_ADMIN adds Linux* capabilities. (This is basically root access to the host.)

- To view the details of the current running container, such as ID and the time it takes to run, use the following command:
docker ps
- To access a running container:
docker exec -it <containerID> bash
Where: -it instructs Docker to allocate a pseudo-TTY connected to the container's STDIN. This creates an interactive bash shell in the container. - To install SSH: Before installing SSH, make sure all the packages are upgraded. If not, update them with the following commands:
apt-get update
apt-get upgrade
apt install ssh
Enable a Passwordless SSH Connection Between Containers
In a Host Container
ssh-keygen -t rsa
The key is saved in this path: (/root/.ssh/id_rsa.pub))
service ssh start
service ssh status
Ssh-keygen is used to generate or create SSH keys. To start the ssh service, use the service ssh start command. With help from service ssh status, check whether SSH is running. The output of this command looks like this: * sshd is running.
Copy the content inside id_rsa.pub, and then paste it inside the target Docker container at the following path: ~/.ssh/authorized_keys
Do this process after starting the target Docker container and installing SSH.
In a Target Container
mkdir ~/.ssh
cd ~/.ssh
touch authorized_keys
vi authorized_keys
Copy the contents of the host id_rsa.pub file, and then paste the content in this file.
service ssh start
service ssh status
Approaches
Method 1: Use a Command-Line Interface
Intel VTune Profiler provides a command-line interface. This is especially useful for remote analysis, scripted commands, and conducting regular performance regression checks to monitor software performance over time.
After copying the content inside id_rsa.pub to the target, ~/.ssh/authorized_keys, run the following command on the host container.
vtune -target-system ssh:root@<Target name> -target-install-dir=/tmp/vtune_profiler -collect hotspots -app-working-dir /usr/bin <Path to the application in the Target container>
For example:
vtune -target-system ssh:root@Target -target-install-dir=/tmp/vtune_profiler -collect hotspots -app-working-dir /usr/bin <Path to the application in the Target container>
The previous command sets the destination as the target Docker container, saves all the mandatory dependencies in tmp/vtune_profiler directory, and runs the analysis on the given application.
For more information, see Generate Command-Line Reports.
Method 2: Use the Intel VTune Profiler GUI
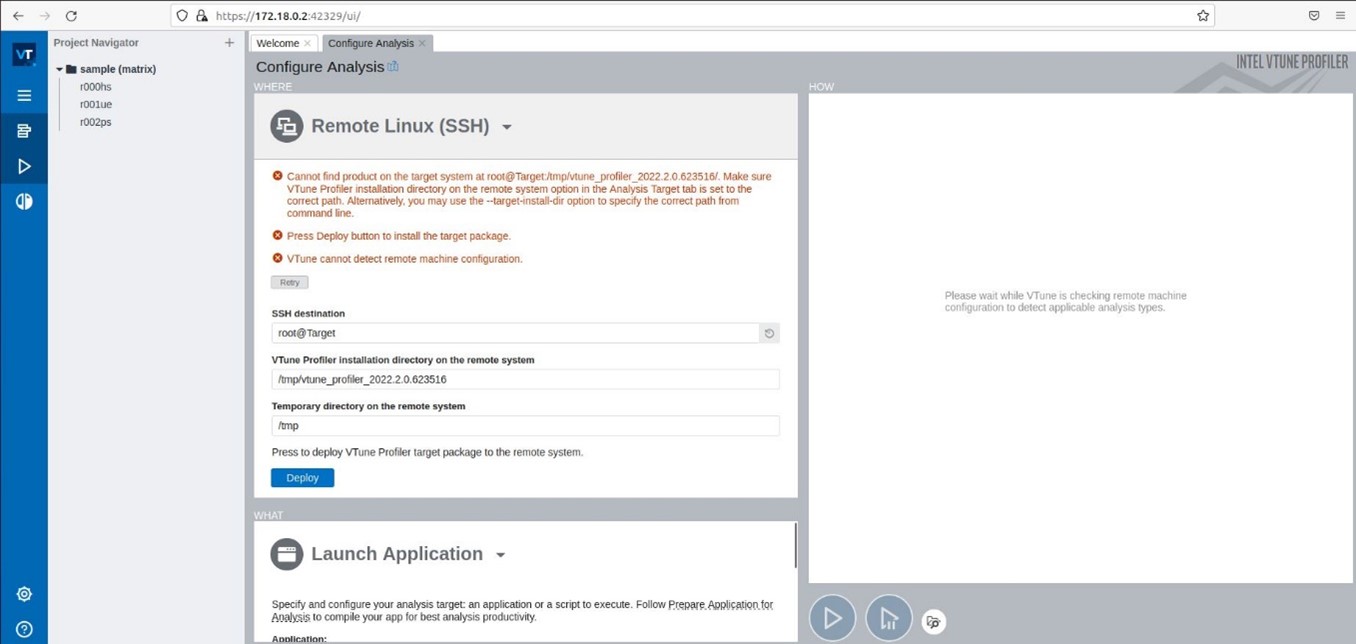
When you create a project, Intel VTune Profiler opens the Configure Analysis window. It prompts you to specify:
- What to analyze. (You need to give a path to an application, process, or a whole system.)
- A system where you plan to run the analysis.
- How to run the analysis.
Select anywhere on the analysis header that contains the name of the analysis type. This opens the Analysis Tree, where you can see other analysis types grouped into several categories.
Inside the host Docker container, use the following command:
vtune-backend --allow-remote-ui --enable-server-profiling
After you run the command, two links are generated. To access the Intel VTune Profiler GUI, open any of the links in a browser.
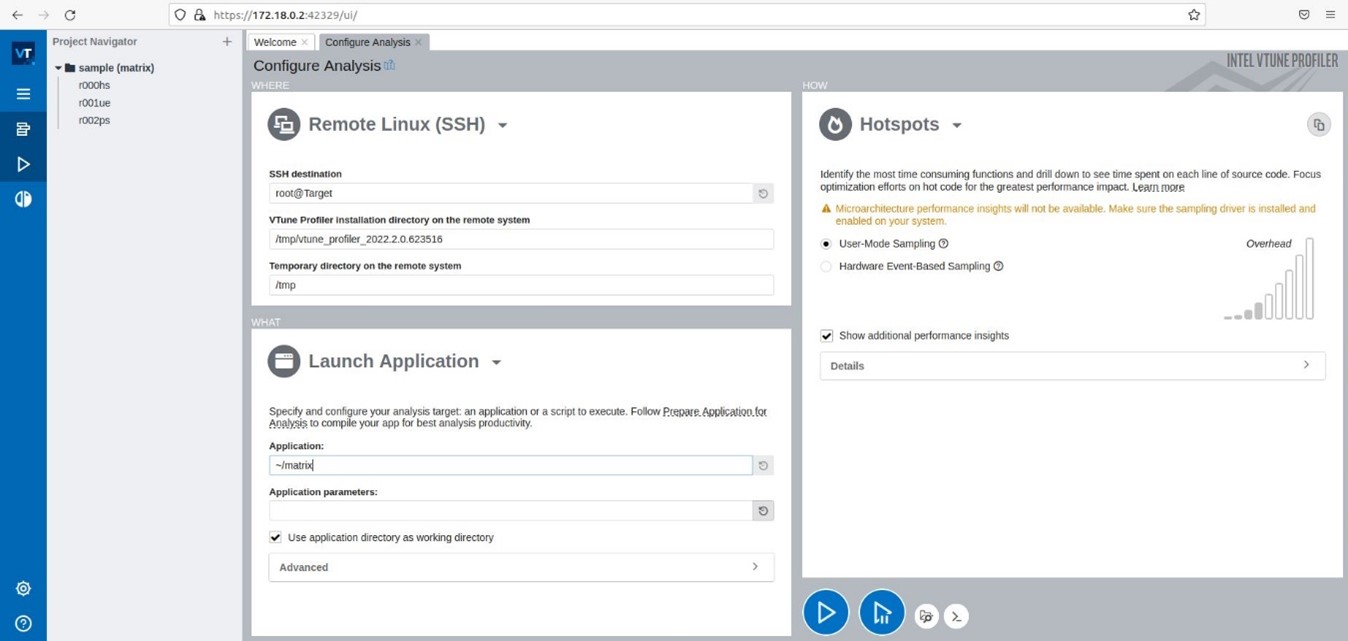
- Select the Configure Analysis and then select Remote Linux (SSH).
- In SSH destination, enter root@Target.
- For the Intel VTune Profiler installation directory on the remote system, keep the default at /tmp/vtune_profiler.
- For the temporary directory, keep the default at /tmp.
- Select Deploy.
- To run the analysis, select the Start button.
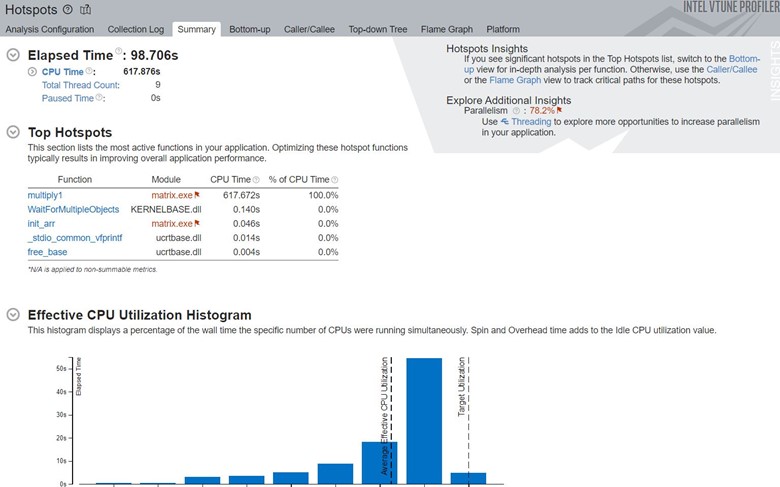
When the data is collected, Intel VTune Profiler opens it in the Hot Spots by CPU use window. The window provides the following tabs for analysis:
- Summary displays overall application run statistics to analyze CPU time and processor use.
- Bottom-up displays hot spot functions in the bottom-up tree, CPU time, and CPU use per function.
- Top-down Tree displays hot spot functions in the call tree, performance metrics for a function only (self value), and for a function and its children together (total value).
- Caller/Callee displays the parent and child functions of the selected focus function.
- Platform gives details on CPU and GPU use, frame rate, memory bandwidth, and user tasks (if corresponding metrics are collected).
Known Issues
- While profiling on Docker containers, certain analysis like anomaly-detection, Platform profiler wouldn’t work.
- Function-level analysis is not available by default. Intel VTune Profiler maps the samples to the binaries from the user target application, but it cannot resolve the functions because the binaries from the host are not available from the container.
Solution: Run the Docker container with the mounted host folder containing the binaries and specify a search directory as an argument to the vtune command. - Intel VTune Profiler is run in the container by the root user while the application on the host is run by a non-root user. As a result, User-Mode Sampling Hotspots analysis fails to run with an error: "Both target and VTune Profiler should be run by the same user."
Solution: Make sure the same user runs Intel VTune Profiler in the container and the target app outside the container.
Conclusion
Try this profiling method when you have a host operating system on your PC that is unsupported by Intel VTune Profiler (as per system requirements). So, you can profile an application on the target container through a host container where Intel VTune Profiler is installed.
For more information, see: